
Bitcoin USD daily basis
Bitcoin USD Chart Analysis – Breaking the downward consolidation phase
At the beginning of the reporting week, the market was looking for clues of sustainability of the fast-moving breakout from Friday of the previous week. We recall: the Twitter mention by Elon Musk led to a daily excursion above $38’000 USD and briefly above the forming descending trend line since the beginning of the consolidation. However, a considerable part of these daily gains were given back and since then, the Bitcoin price has been hovering around the $33’000 zone. On Monday, the price continued to trade accordingly in narrow trading ranges in the 33k territory. On Tuesday, the break of the trend line led to some buying, which took Bitcoin above the $35’000 level by the end of the day. On Wednesday, follow-on buying already led to the resistance zones around $37’000 USD. On Thursday, the price consolidated above $37’000. Friday was once again characterized positively, and this led to a daily close at $38’336, which corresponded to the daily high. This showed enough confidence to visit the area of the all-time high generated 29 days ago again. Saturday’s trading led accordingly at the day’s high, at just under $41’000, only 1’000 USD below the all-time high reached earlier. On Sunday, a breather followed and let the price go out of trading at good $39’000. The liberation from the previously negative formation led to renewed strength in the market.
Exuberant price discovery comes to a temporary end
Review Daily Interval
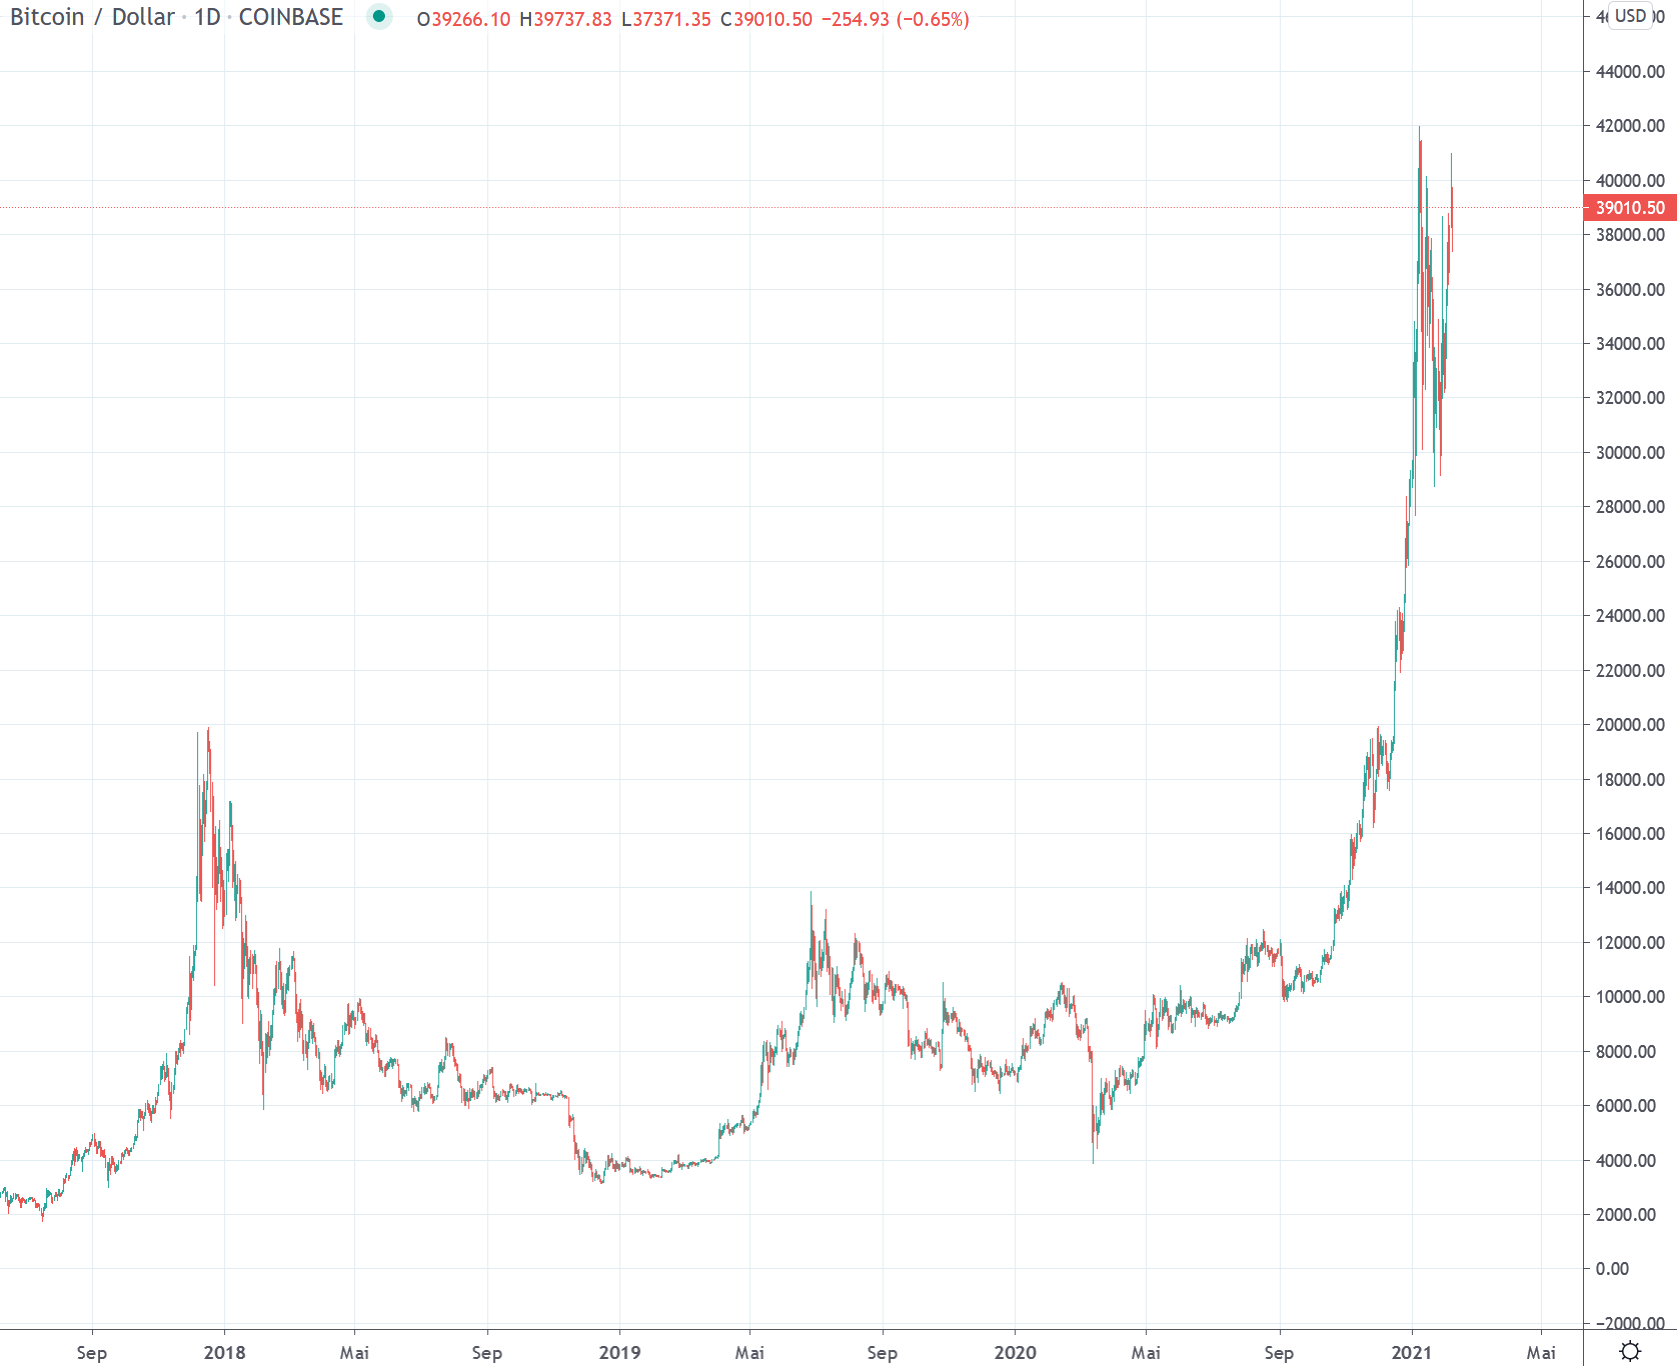
After the price plunge of mid-March 2020, a veritable countermovement established itself. This led to the resistance zones from $10’000. After an initial rejection and a consolidation phase lasting almost two months, a breakout through the fundamental resistance zone followed on July 27, which had been established since August 2019 and had already caused Bitcoin to fail a few times to date.
The resistance zone around $10’000 was interesting in several respects. On the one hand, the 0.618 Fibonacci point of the entire downward movement, which was initiated at the end of June 2019 just below $14’000 USD, is located here. On the other hand, the zone around $10’000 simultaneously acted as a confirmation of the still bearish trend from lower highs since December 2017 (see macro view on a weekly basis). Bitcoin was able to establish itself above the newly created support in the $10’000 area since the end of July 2020 and provided a first confirmation of a trend reversal with the break of the resistance zone around $12’200 towards the end of October 2020. The aforementioned resistance zone had been effective since January 2018 and served as a zenith for the price several times since then. In the following weeks, the positive trend accentuated and led Bitcoin through the $14’000 resistance in early November 2020 and close to the then all-time highs around $20’000 for the first time in early December, which remained untouched for 158 weeks since the bull market in 2017.
Since the breakout through the important $14’000 resistance at the beginning of November, it has been blow by blow. The break through the old all-time high at $20’000 saw a strong accentuation of the uptrend. The continued parabolic upward movement led to a new all-time high at $42’000 and came to a temporary end on January 8.
Outlook
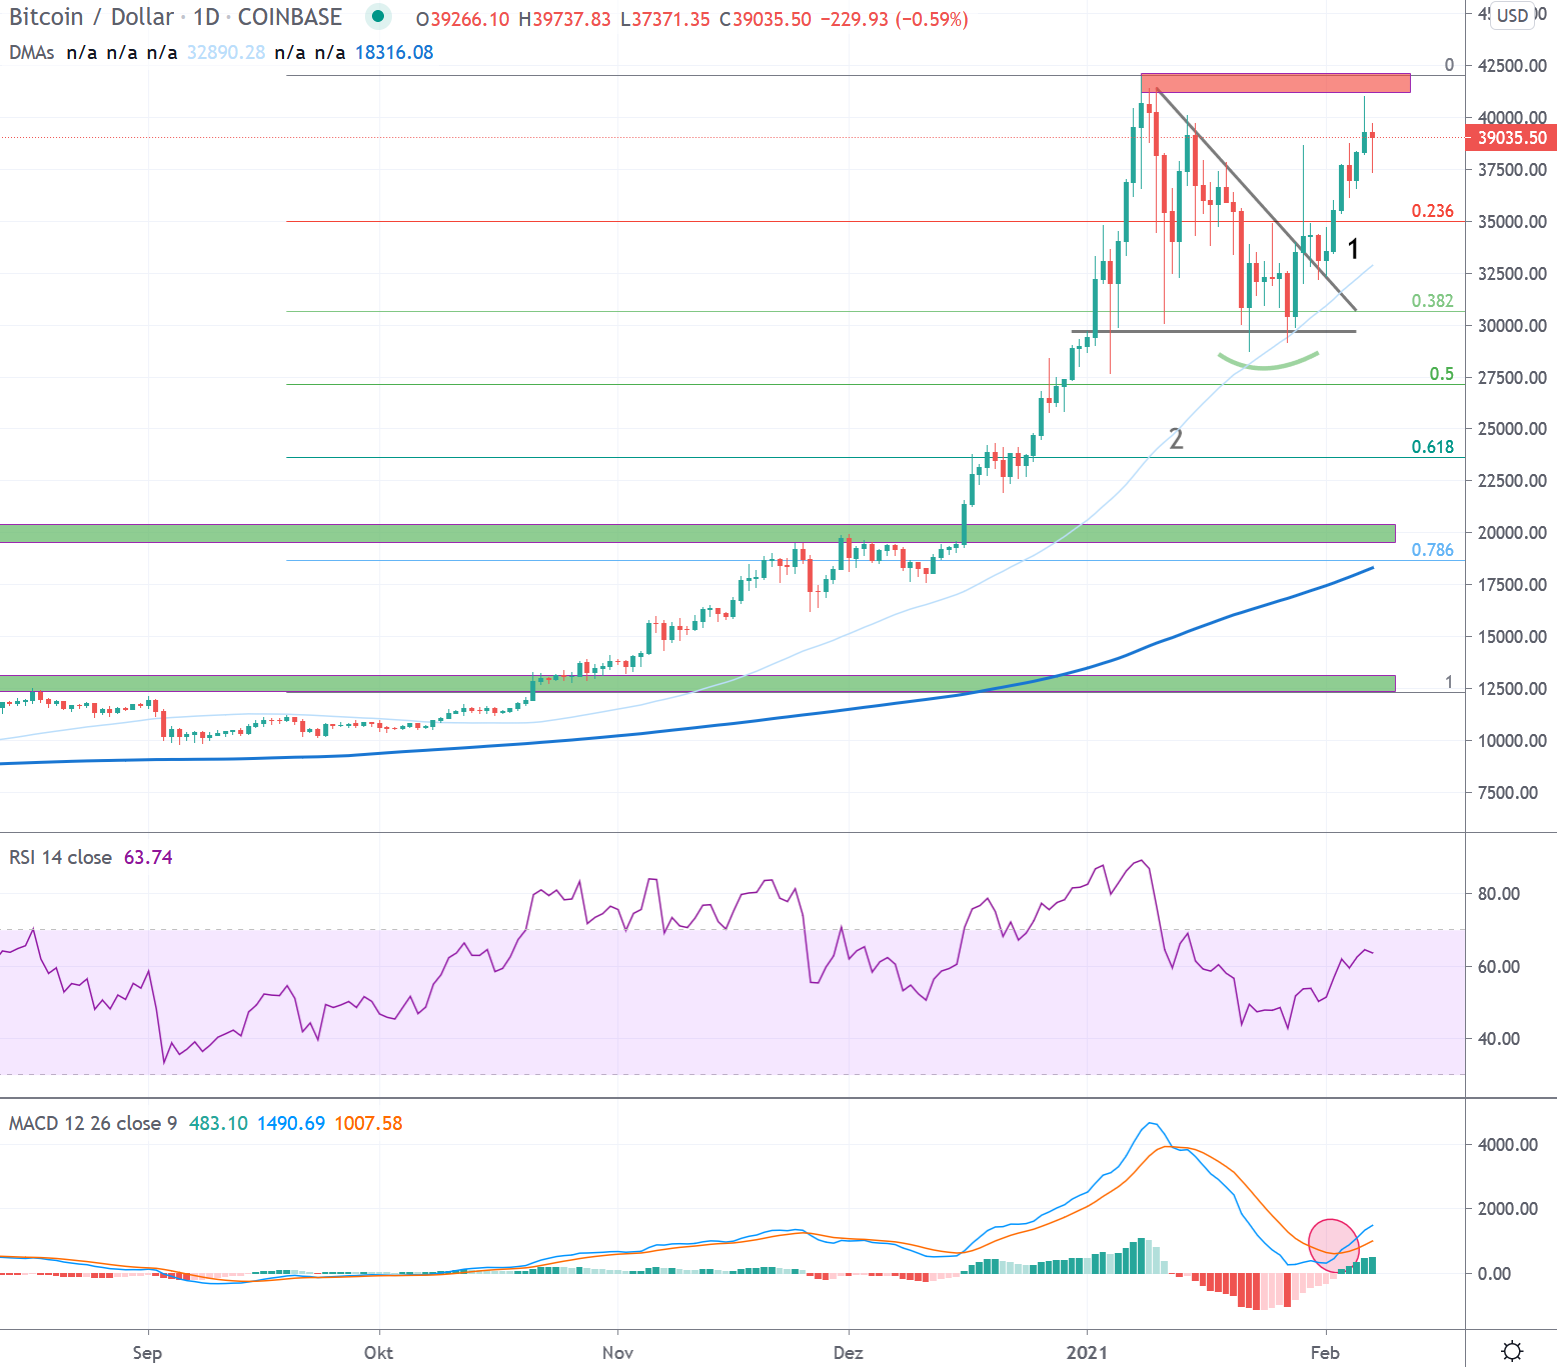
Since the all-time high, a descending triangle formed with several corrections, which reached the $30’000 zone, with decreasing volatility. In the reporting week, a sustainable breakout of the upper trend line of the formation was achieved and led to an appealing price increase. This increases the chances that the previously seen lows just below $30’000 already represented the low of the recent correction. This is supported by the consistent series of higher daily lows since the low reached on January 22. Since the confirmed breakout in October, the correction would thus have taken place in the area of the 0.382 Fibonacci retracement point.
Bitcoin managed to negate its recent bearish structure in the daily interval. The new positive picture will remain as long as the price can hold above the $34’500 – $33’500 support zone. Just below it is also the 50 day moving average (light blue line), which was a good indicator in the recent correction. The ultimate resistance is the all-time high at $42’000.
Should a short-term forcing of the all-time high fail, respect for the previously overcome resistances is necessary for a sustainable establishment of the uptrend. A retest of the $30’000 level would therefore be viewed negatively. More fundamental support can be found around $25’000. In this area is the 0.618 Fibonacci point, which has been calculated since the beginning of the breakout through important resistance zones in October and the all-time high (2). This is followed by another support zone near the old all-time high at around $20’000.
Macro: New all-time highs
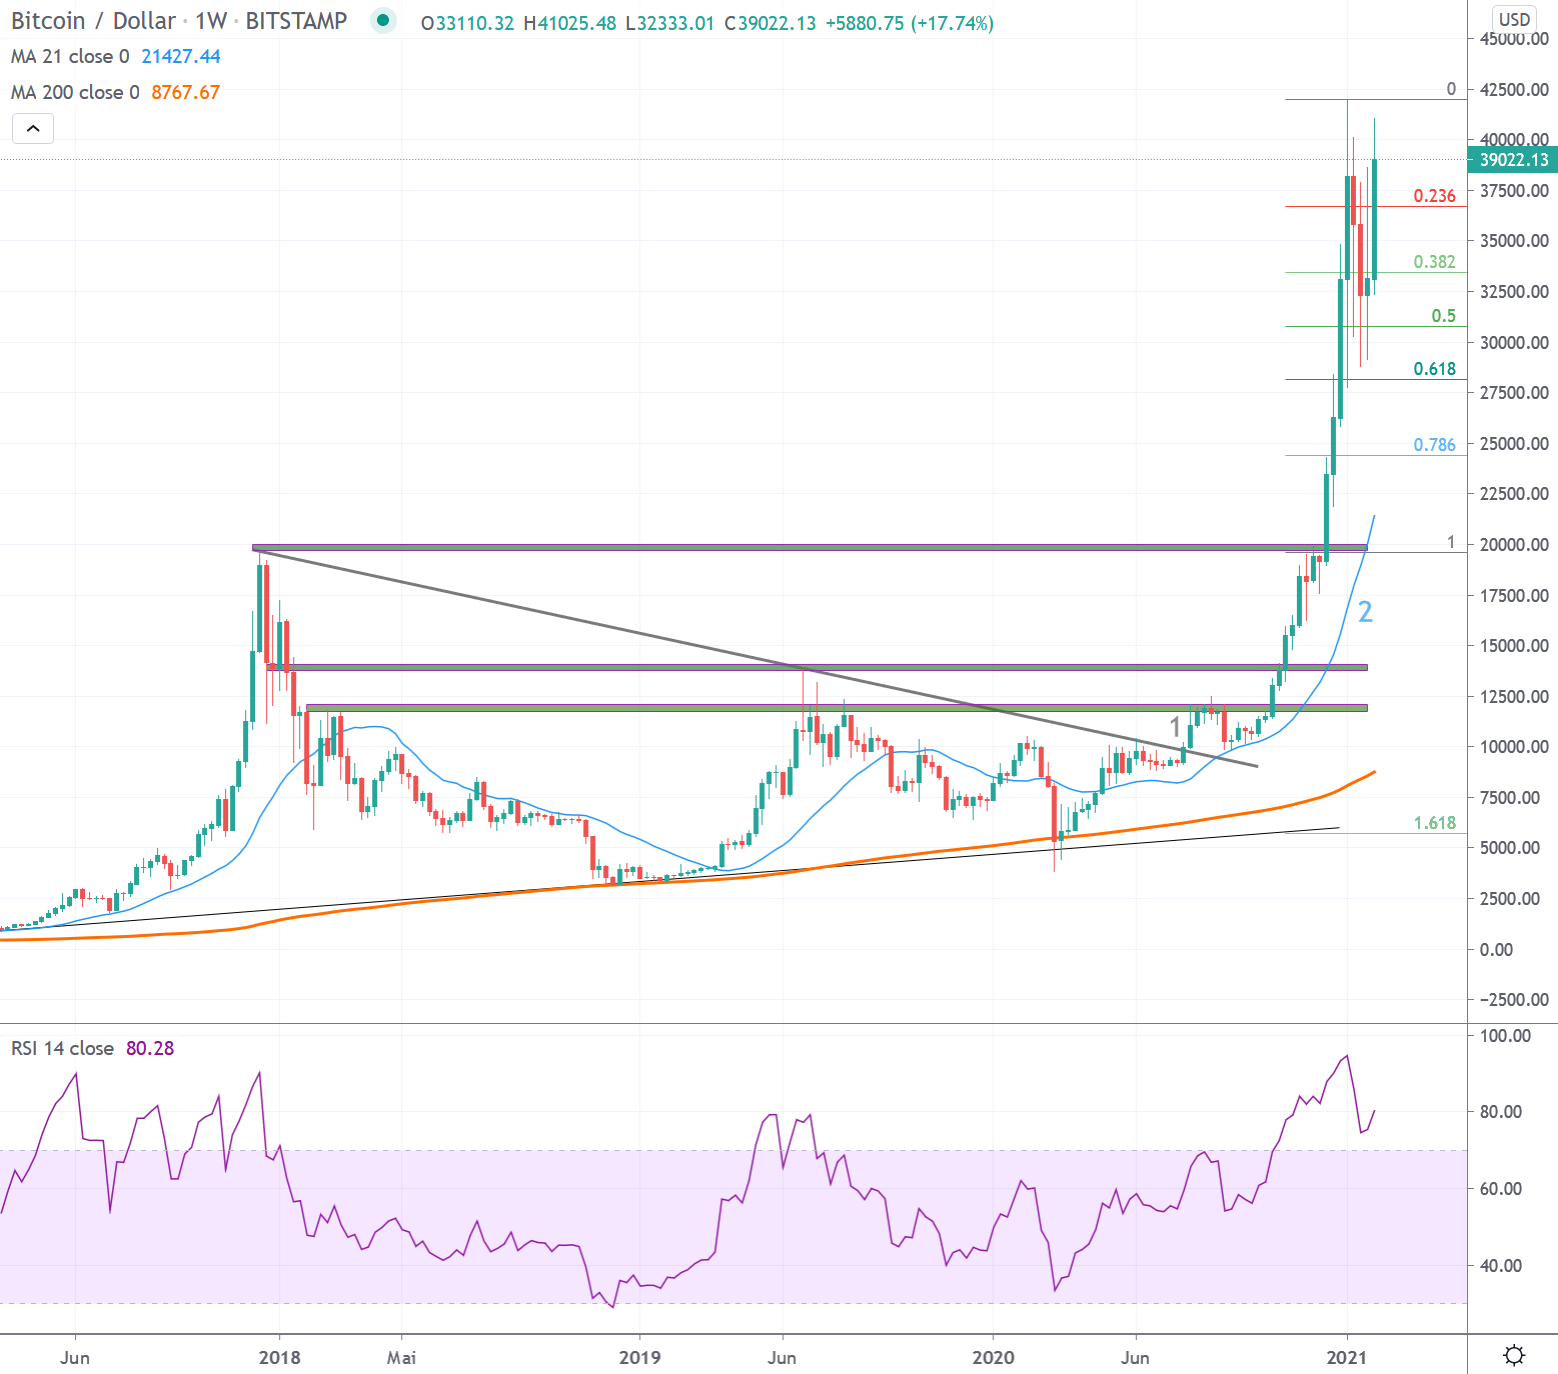
Bitcoin was able to set a higher high above $10’000 for the first time in the weekly interval in 2020, which broke the prevailing bearish trend since December 2017. This broke the series of lower highs that lasted for 135 weeks (1).
Since the break of the bearish trend, signs of a valid trend reversal have been building up. With the push through important resistance zones and a continuous development above the 21-week average (2), the probabilities for a renewed reaching of the all-time high created in 2017/18 increased. This was accomplished in mid-December 2020. Since then, a strongly accentuated price discovery above this mark has been taking place.
With the price movements in the past year, a good foundation was created to sustainably climb new spheres beyond the all-time highs reached in 2017. The break of $20’000 impressively demonstrated the power of the upward movement that had been established since October. It culminated in a parabola, which reached its preliminary high at a good $42’000. Corrections become more likely after such accentuated price increases. Such a correction is now taking place. The zone above $28’000 can be seen as the first support. Here is the 0.618 Fibonacci point, which is calculated since the breakout above $20’000 and the current all-time high. This zone has been respected for the time being. It remains to be seen whether this already represents the low of the recent consolidation. An indication will bring a possible advance above the all-time high.
In case of a continued correction, a sustainable respect of the previously created supports (green) over the next weeks/months will be required in order to continue to decisively advance into new price spheres in the future. The first support in the weekly interval is located at around $20’000. This support zone is gaining in significance, as the 21-week average is now also approaching the area. The area between $14’000 and $12’000 serves as further support zones. However, reaching these levels would cause lasting damage to the entire structure.
*Originally posted at CVJ.CH
Disclaimer
All information in this publication is provided for general information purposes only. The information provided in this publication does not constitute investment advice and is not intended as such. This publication does not constitute and is not intended as an offer, recommendation or solicitation to invest in any financial instrument, including cryptocurrencies and the like. The contents contained in the publication represent the personal opinions of the respective authors and are not suitable or intended as a basis for decision-making.
Risk notice
Investing in cryptocurrencies, is fundamentally associated with risk. The total loss of the invested capital cannot be excluded. Cryptocurrencies are very volatile and can therefore be exposed to extreme price fluctuations in a short period of time.
