
Bitcoin USD – Renewed assertion above 10’000 USD
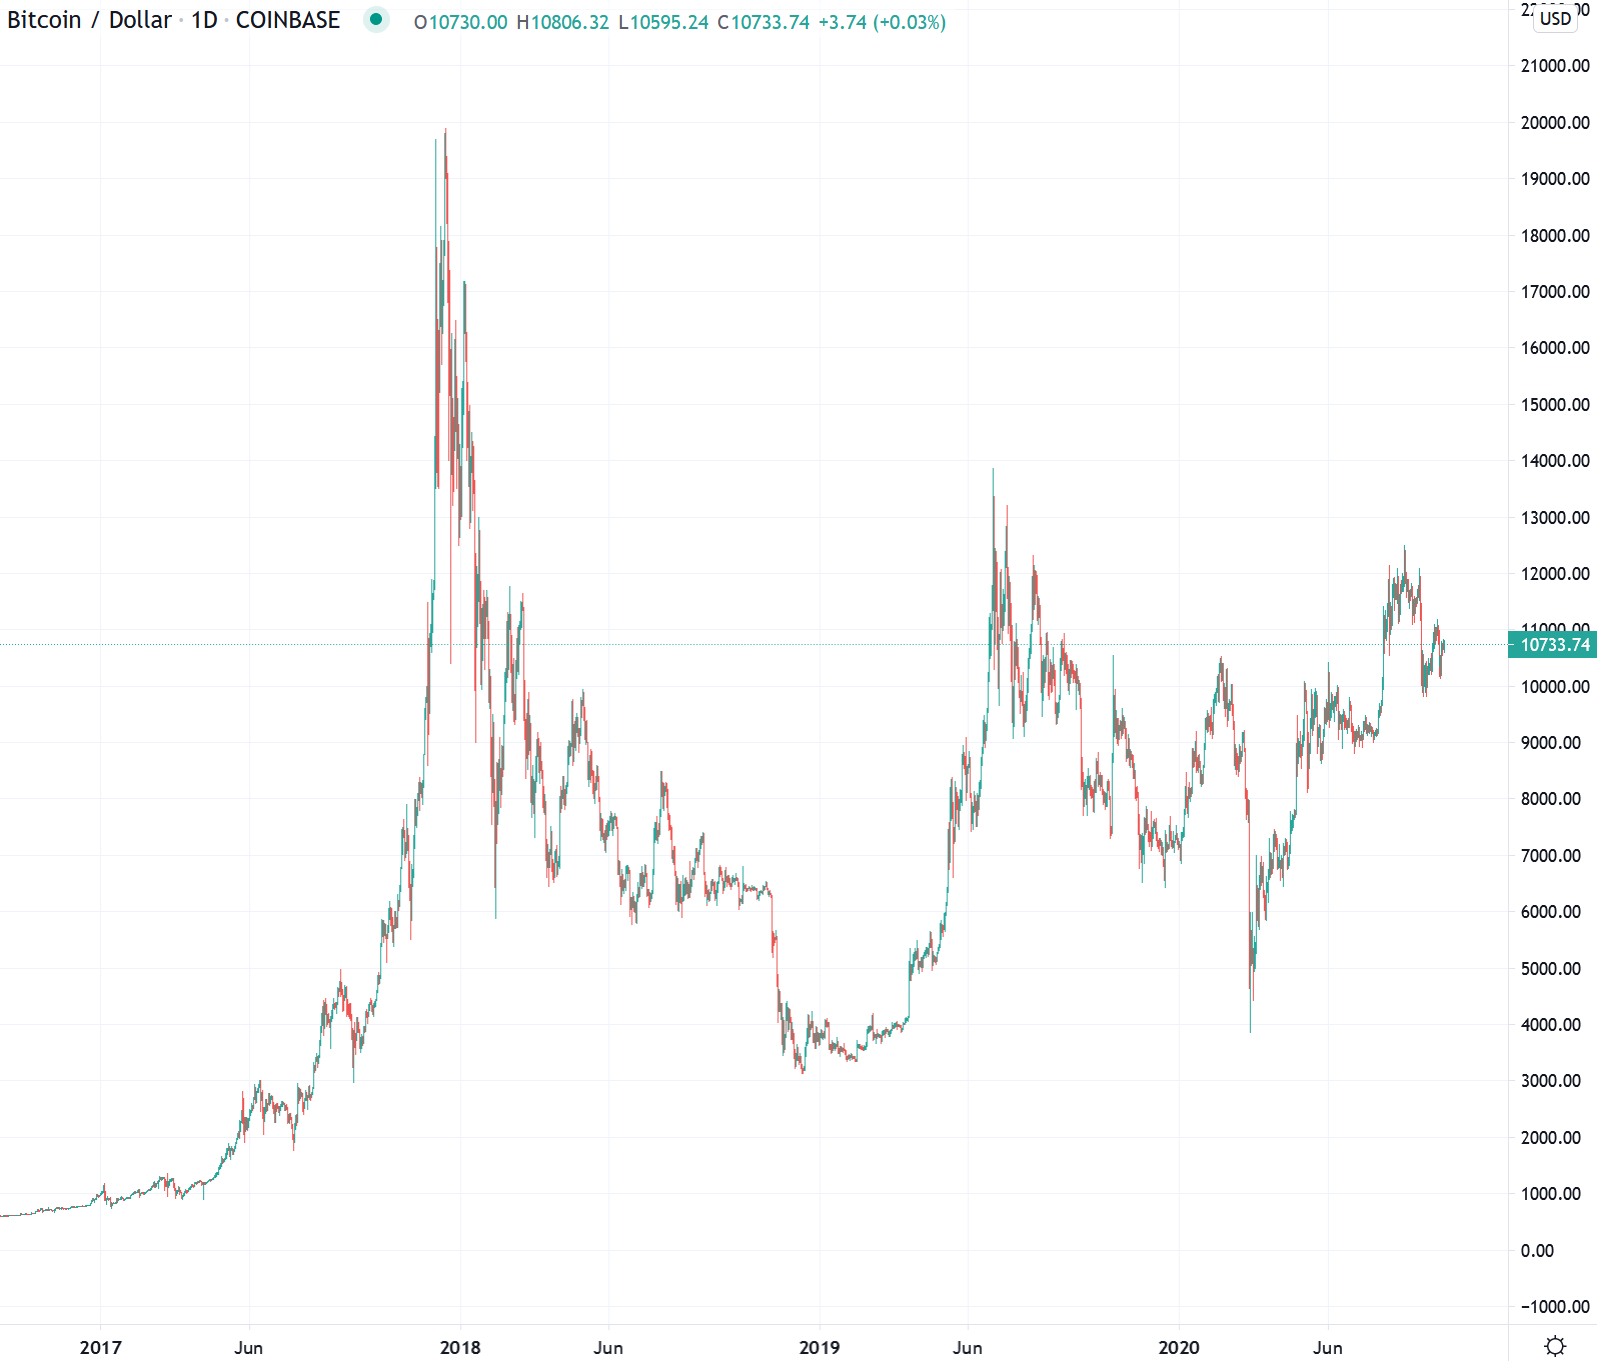
The reported week started with a drop in the Bitcoin price, which brought Bitcoin back to the 10,150 zone on Monday. The USD 11,000 zone of the previous week was thus rendered void in an instant. Until the middle of the week Bitcoin held its ground in a trading range between USD 10,250 – 10,500. On Thursday a price increase followed, with a daily closing price of USD 10,700. Until the end of the week, the price remained at this level within narrow trading ranges.
Test of the newly created support
Review of the daily interval
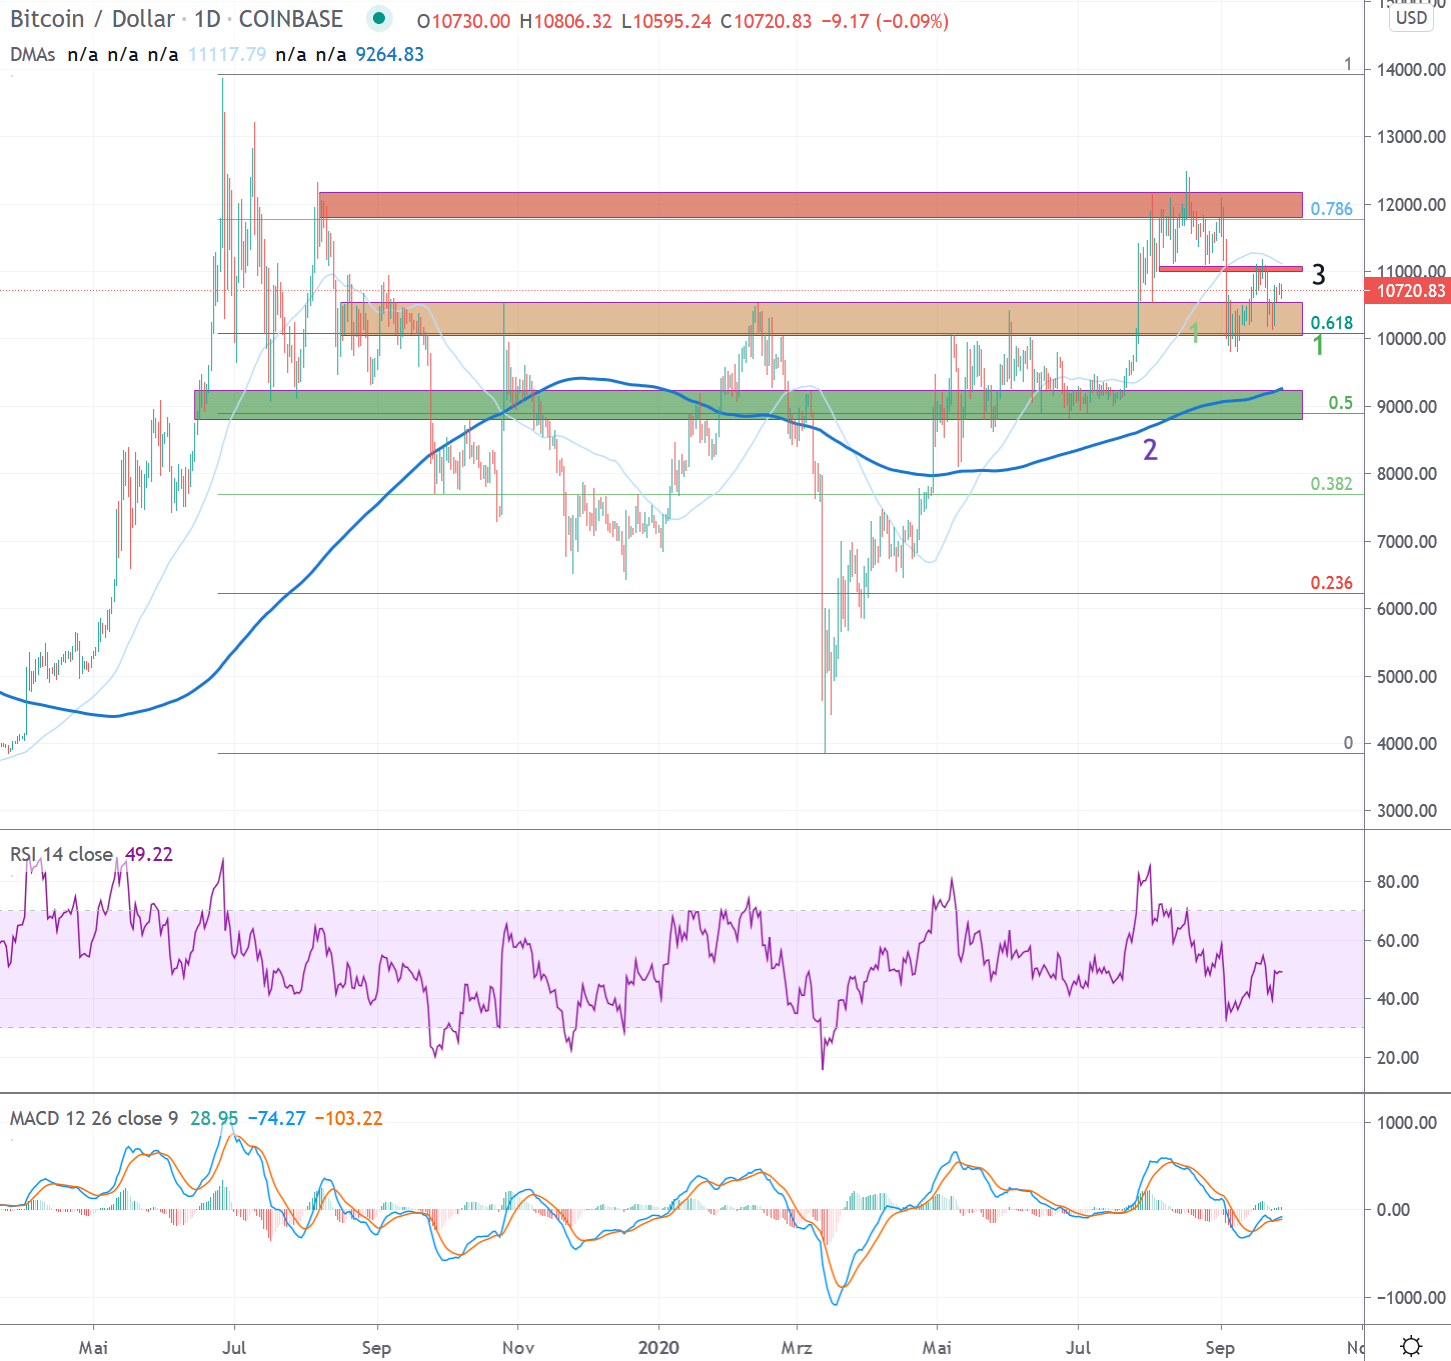
A veritable countermovement established itself after the price slump in mid-March. This led up to the resistance zones starting at USD 10,000. After a renewed rejection at the beginning of June, an almost two-month consolidation was observed. This was characterized by a series of higher daily lows and lower daily highs. The series of lower highs was broken on 22 July. This was followed on July 27 by a break through the resistance zone around USD 10,500, which has been established since August 2019 and which Bitcoin has already failed to break several times.
The resistance zone around USD 10,000 was interesting in several respects. On the one hand, the 0.618 Fibonacci point (1) of the entire downward movement, which was heralded at the end of June 2019 just below USD 14,000, is located here. On the other hand, the zone around $10,000 also served as a confirmation of the still bearish trend of lower highs since December 2017 (see next section). This zone now counts as a significant support (green).
Outlook
Bitcoin is currently testing the newly created support in the 10,000 USD range. This zone serves as an important pillar of the positive trend. In the reporting week, this zone was defended once again after Monday’s price decline. A bullish assessment would be a renewed attack on the USD 11,200 resistance that formed between the end of July and the beginning of September (3). On the other hand, there is still the possibility that USD 10,000 could be tested and broken again. In this case, the rally since the sharp correction on September 3 must be seen as a simple countermovement in an emerging bearish environment (bearish retest).
The next days/weeks will cast light on the strength of the bulls. If the resistances above 11’200 USD can be broken, the resistances above 12’000 USD will ultimately remain decisive (red). These are significant and continue to serve as an indicator of whether the market is serious about the recent trend reversal.
Should the USD 10,000 fall, further support is expected below USD 9,500 from trading activities from the end of April to mid/end of July 2020 (green). The 200 daily average is now located in this area (2). In such a scenario, a longer-term consolidation in the USD 9,000 – 11,000 range is expected.
Macro: Series of lower highs broken since end of 2017
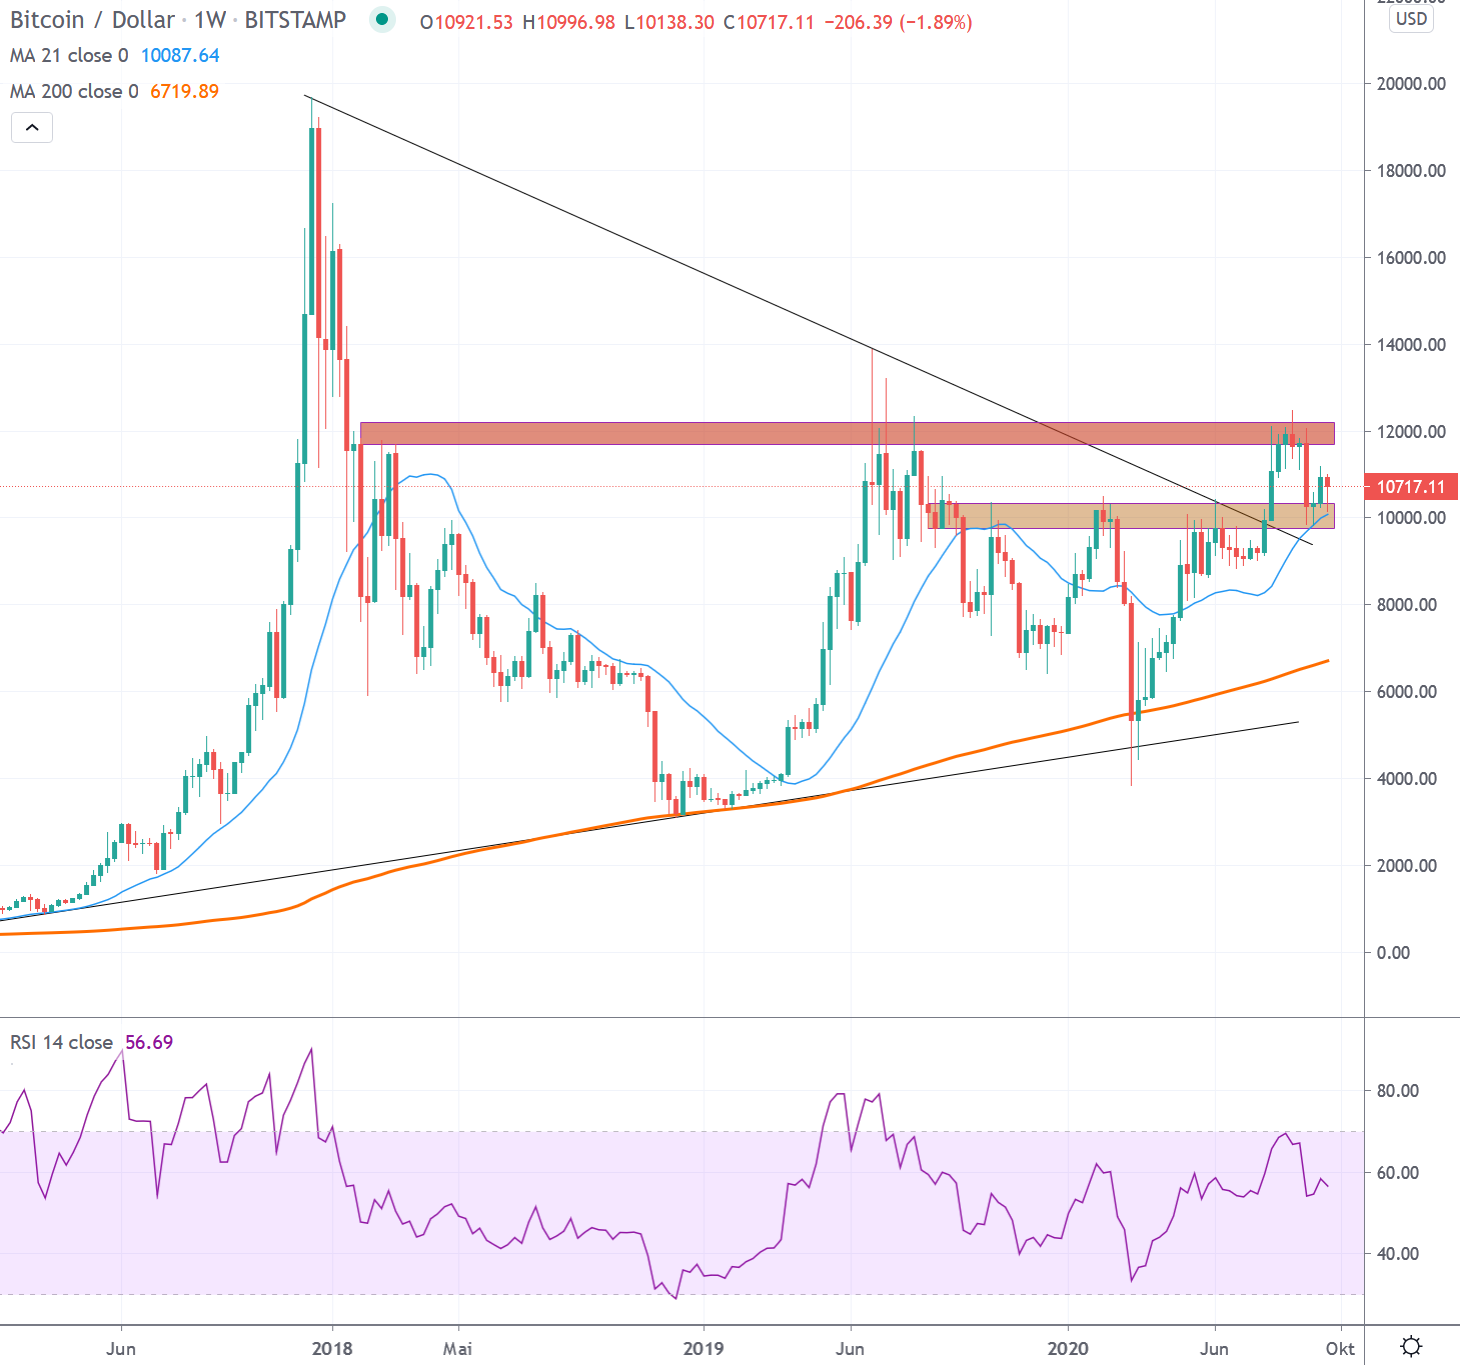
Bitcoin was able to set a higher high for the first time in the weekly interval, breaking the prevailing bearish trend since December 2017. The series of lower highs, which lasted for 135 weeks, was thus interrupted (marker). In order to change the negative macro picture into a valid trend reversal, the breakout should be legitimized by several weekly candles above the USD 10’000 mark.
An establishment above USD 10’000 and a consistent overcoming of the resistance around USD 12’000 over the next weeks speak for a legitimacy of the trend reversal. If the Bitcoin price can then consolidate above USD 12,000 again, the chances of an attack on the all-time high of a good USD 20,000 would certainly exist.
A drop in the price, which would bring the price back into the USD 9,500 range and below over several weeks, would damage the positive momentum and argue for a longer consolidation.
