
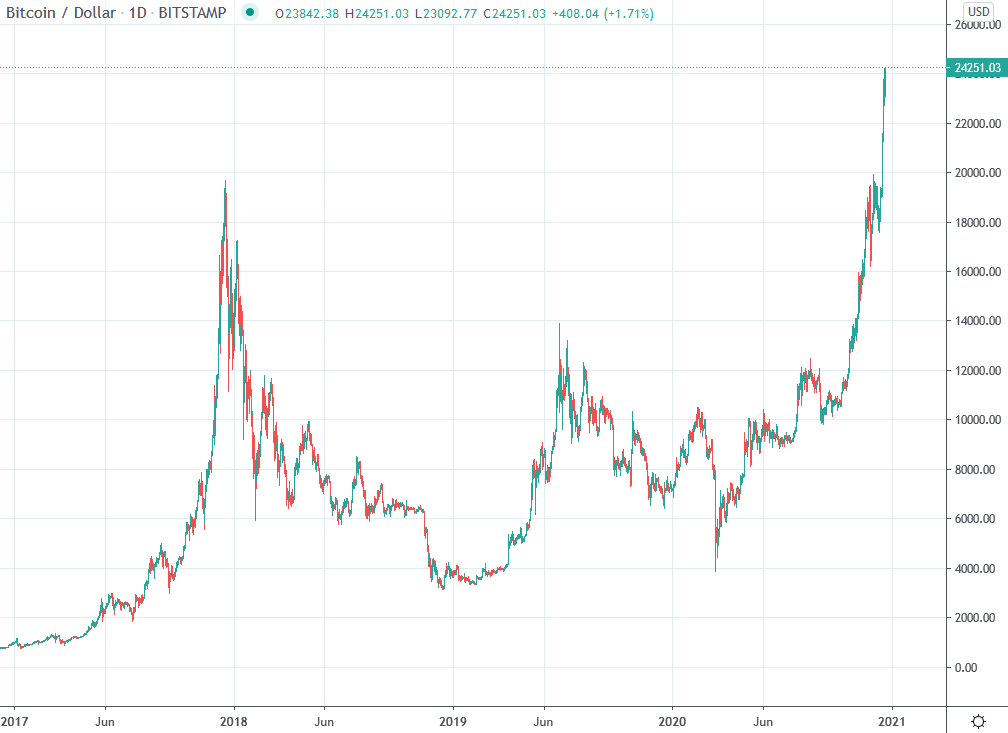
Bitcoin USD daily basis
Bitcoin USD Chart Analysis – New all-time high
On Monday, the bitcoin price moved within a narrow trading range at the 19,000 zone. At that point, investors were looking back at a 14-day consolidation phase after the all-time high of 2017 was surpassed for the first time. Only three days earlier, the price reached the lowest point of this short consolidation at around USD 17,500. The quick recovery to the highs were a first sign that the bulls did not want to hand over the handle yet. On Tuesday, the trading picture was similar to the previous day, but at a slightly higher level around 19,300 USD. On Wednesday, an impressive breakthrough of the 20’000 USD mark followed. With the highest realized daily gain of the week (+10%), the bitcoin price catapulted to a daily closing price of 21’340 USD. A clear sign of continuing appetite on the unexplored territory. Thursday saw a further surge in prices, which reached almost USD 24,000 at the high of the day and closed at USD 22,850. The trading volume even exceeded that of Wednesday. With two subsequent trading days, each characterized by higher daily lows and highs, the bitcoin price reached a price of a good 24,200 USD on Saturday. A short consolidation on Sunday was followed by another upward movement, which lifted the price back above USD 24,000.
Price discovery in new territory
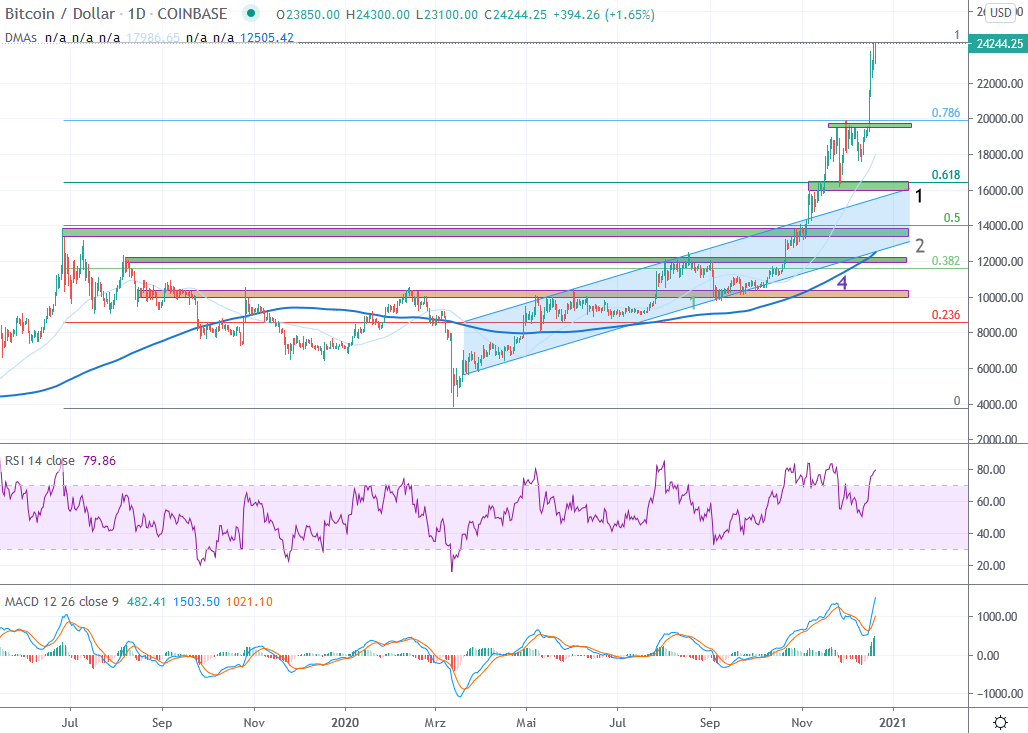
Review Daily Interval
A veritable countermovement established itself after the price slump in mid-March. This led up to the resistance zones starting at USD 10,000. After a renewed rejection at the beginning of June, an almost two-month consolidation was observed. This was characterized by a series of higher daily lows and lower daily highs. The series of lower highs was broken on 22 July. This was followed on July 27 by a break through the resistance zone around USD 10,500, which has been established since August 2019 and which Bitcoin has already failed to break several times.
The resistance zone around USD 10,000 was interesting in several respects. On the one hand, it contained the 0.618 Fibonacci point of the entire downtrend, which was heralded at the end of June 2019 just below USD 14,000. On the other hand, the zone around USD 10,000 simultaneously served as a confirmation of the still bearish trend of lower highs since December 2017 (see next section). This zone now counts as a significant support (green).
Bitcoin has been able to establish itself above the newly created support in the USD 10,000 zone since the end of July. This support was confirmed by a re-test in early September and has since then served as the beginning and important pillar of the recent positive trend. Since then, further significant resistance zones have been overcome. On October 21, for example, the resistance zone around USD 12,200 was breached, which was established as early as January 2018 and has served as the zenith for the Bitcoin price on several occasions thereafter (see macro outlook). In the following weeks, the positive trend intensified and led Bitcoin to the “last visible resistance” at USD 14,000, before the all-time high.
At USD 14,000, an important resistance that stood in the way of a “clear sky” scenario up to the all-time high was passed. An impressive act of strength and a first-class proof that the market is serious about the trend reversal that has been initiated this year. The breakthrough was reinforced by the simultaneous break of the upper trend line of the trend channel that has been forming since March (light blue). This led to a strong accentuation of the uptrend from the beginning of November, which most recently brought the Bitcoin price in a parabolic rise to the all-time high of December 2017.
Outlook
The parabolic rise, which catapulted the bitcoin price from USD 12,000 to over USD 19,500 within 34 days, came to a temporary end just above the all-time high reached in 2017. The consequence was a two-week consolidation in the zone between USD 16,180 and 19,870. In the reporting week, Bitcoin managed to break through the psychologically important USD 20,000 mark. As expected, this led to another price spike and takes Bitcoin into unexplored price discovery territories. Resistances are consequently non-existent for the time being. The zone between USD 19,500 – 20,000, which previously represented the last resistance, serves as the first support. This is followed by further support zones at USD 16,000 and USD 14,000 (green).
With the price movements of the last weeks, the market impressively underlined the trend reversal that was initiated this year, which meanwhile results in a parabolic upward movement. Price discovery beyond the historical highs above 20,000 USD is the current market mood. Many things are possible in this phase. For a sustainable establishment, the recently surpassed resistances should be respected as support in the coming weeks (green). At the support above the USD 16,000 level is the 0.618 Fibonacci point of this year’s trading range (1) as well as the upper trendline of the channel that has been established since March 2020 (blue). A fundamental support has also formed around USD 12,000 (2), where the 200-day moving average (4) is also by now.
Macro: New all-time highs
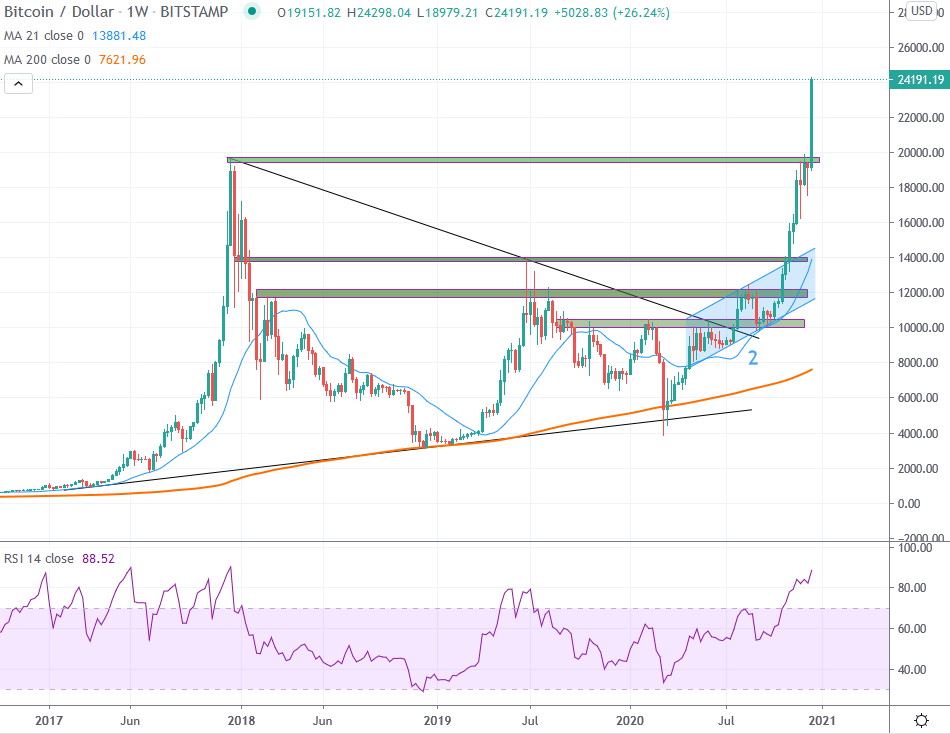
Bitcoin was able to set a higher high above USD 10,000 in the weekly interval for the first time in 2020, which broke the prevailing bearish trend since December 2017. This broke the series of lower highs that lasted for 135 weeks.
Since the breakout of the bearish trend, the signs for a valid trend reversal intensified. With the push through important resistance zones and a continuous development above the 21-week moving average (2), the probabilities for a renewed reaching of the all-time high created in 2017/18 increased. This was recently achieved.
With last week’s price movements, a good foundation was created to reach new spheres beyond USD 20,000. Corrections become more likely after accentuated price increases. In this context, a sustainable respect of the newly created supports (green) over the next weeks/months are required in order to be able to decisively advance into new price spheres in the upcoming period.
*Originally posted at CVJ.CH
Disclaimer
All information in this publication is provided for general information purposes only. The information provided in this publication does not constitute investment advice and is not intended as such. This publication does not constitute and is not intended as an offer, recommendation or solicitation to invest in any financial instrument, including cryptocurrencies and the like. The contents contained in the publication represent the personal opinions of the respective authors and are not suitable or intended as a basis for decision-making.
Risk notice
Investing in cryptocurrencies, is fundamentally associated with risk. The total loss of the invested capital cannot be excluded. Cryptocurrencies are very volatile and can therefore be exposed to extreme price fluctuations in a short period of time.
