
Bitcoin USD daily basis

Bitcoin USD Chart Analysis – Strong correction over the weekend
The reporting week started cautiously and with continued bullish undertone. The market focused on a break of the recently stubborn 60’000 USD resistance zone. Thus, on Monday, it traded in very narrow trading ranges around 59’800 USD. On Tuesday, the breakthrough finally helped Bitcoin to a new all-time high of 63’580 USD. On Wednesday, sustained demand led to another all-time high just below 65’000 USD. However, the onset of profit-taking later in the trading session sent the price back to 63’000 USD and led to a lower closing price than the previous day. On Thursday, the market was indecisive and entered Friday at a similar level to the previous day. Downward pressure in Friday trading led to a first test of the previously climbed resistance zone at 60’000 USD, which from then on served as an important support. Although the price was able to enter Saturday at 61’427 USD, it came to the close of trading at 60’058 USD again a lower daily closing price. The momentum, which prevailed at the beginning of the week, dwindled visibly, and so a strong price correction to take its course began overnight into Sunday. Triggered by the break of the 60’000 USD support zone, liquidations in Sunday’s trading led back to 51’000 USD at the daily low. A subsequent rebound let Bitcoin close the week above 56’000 USD.
Break of the uptrend since the beginning of the year
Review Daily Interval
After the price drop in mid-March 2020, a veritable countermovement established itself. This led to the resistance zones above 10’000 USD. After an initial rejection, and a consolidation phase of almost two months, a breakout through the fundamental resistance zone followed on July 27, which had been established since August 2019 and had already caused Bitcoin to fail a few times to date.
The resistance zone around 10’000 USD was interesting in several respects. On the one hand, the 0.618 Fibonacci point of the entire downward movement, which was initiated at the end of June 2019 just below 14’000 USD, is located here. On the other hand, the zone around 10’000 USD simultaneously acted as a confirmation of the still bearish trend from lower highs since December 2017 (see macro view on a weekly basis). Bitcoin was able to establish itself above the newly created support in the 10’000 USD area since the end of July 2020, and provided a first confirmation of a trend reversal with the break of the resistance zone around 12’200 USD towards the end of October 2020. In the following weeks, the positive trend accentuated and led Bitcoin through the 14’000 USD resistance in early November 2020 and close to the then all-time highs around 20’000 USD for the first time in early December, which remained untouched for 158 weeks since the bull market in 2017.
Since the breakout through the important 14’000 USD resistance at the beginning of November, it has been blow by blow. The break through the old all-time high at 20’000 USD saw a strong accentuation of the uptrend. Subsequently, the price doubled in only 23 days. A first correction brought the price back below 30’000 USD. This was followed by a renewed upward movement, which ultimately led to the price rising above the all-time high of 42’000 USD reached earlier and marking a new all-time high just below 60’000 USD on February 21. This was followed by newly created all-time highs of 61’680 USD on March 13 and just below 65’000 USD in the reporting week. An incipient selling wave at the end of the reporting week brought the price back to 51’000 USD at the daily low.
Outlook
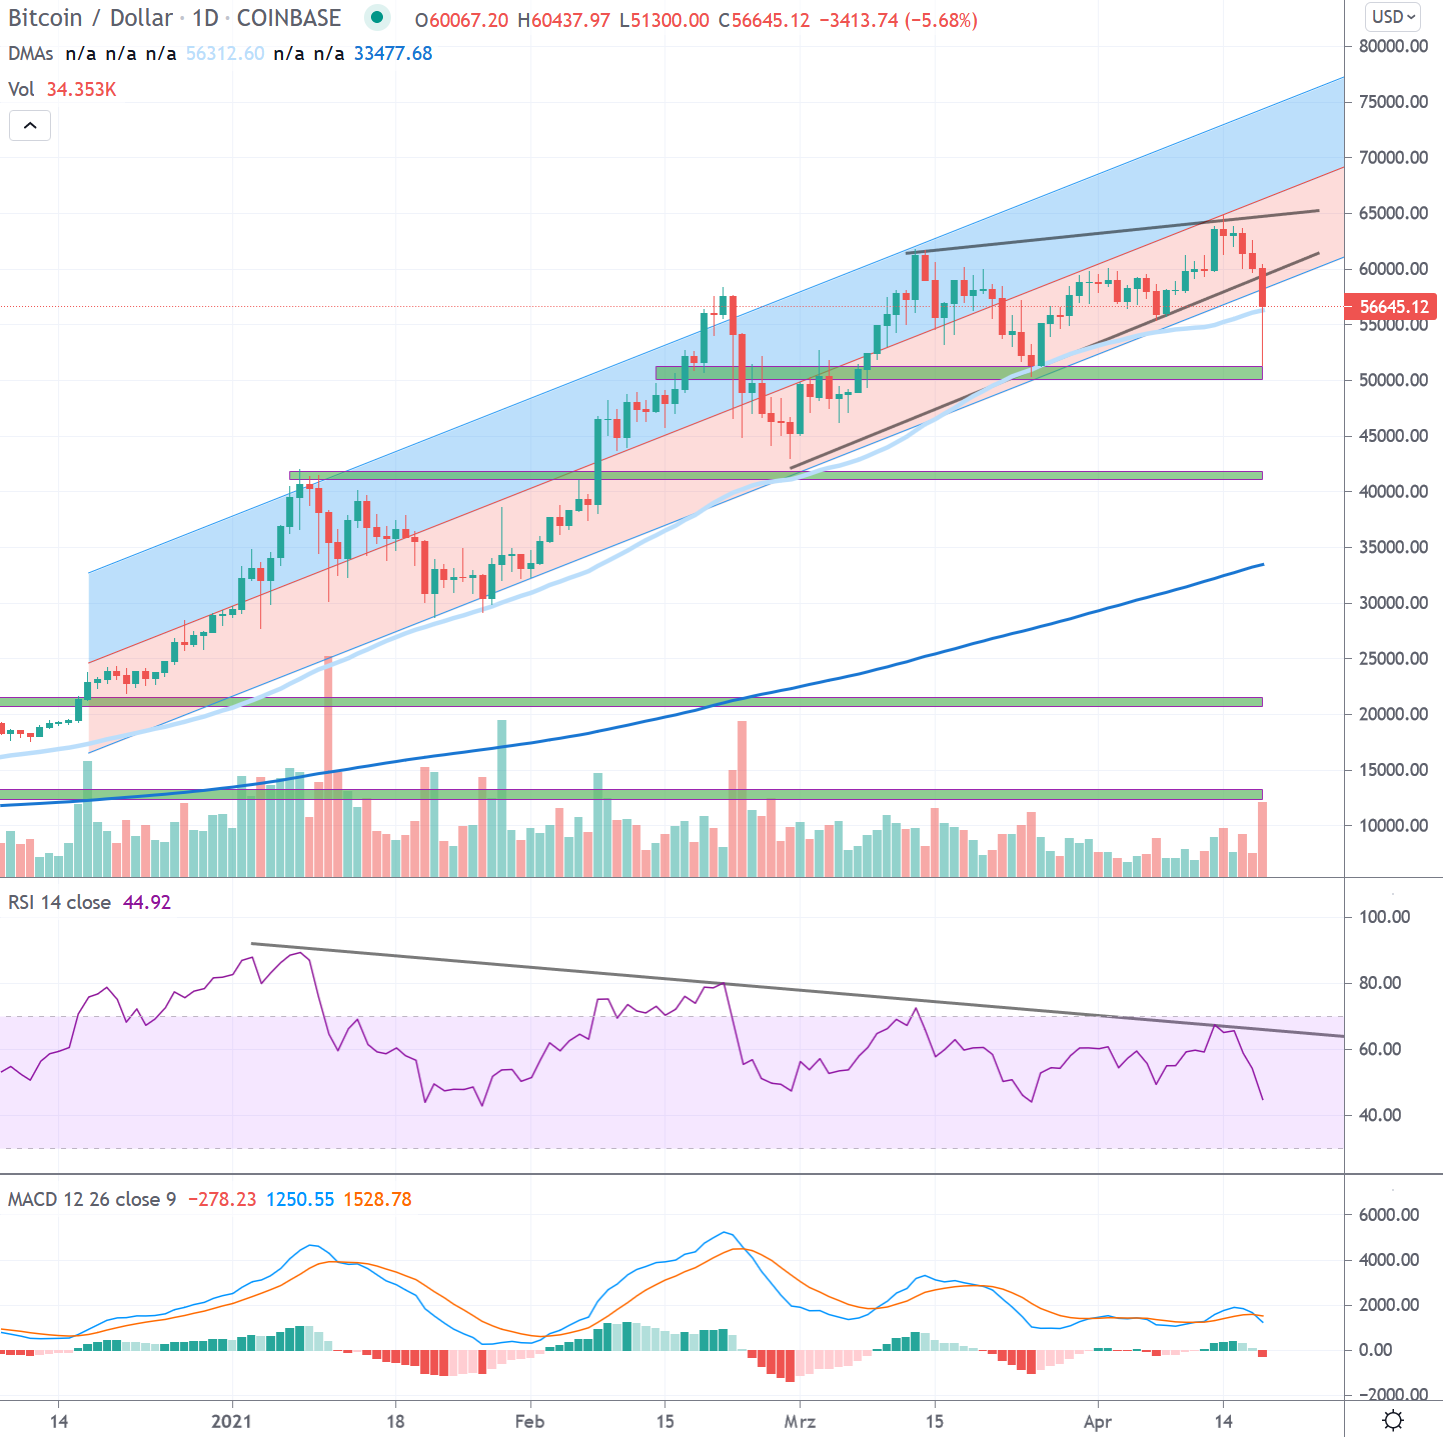
Bitcoin has been in an accentuated uptrend since breaking the 2017 all-time high. This has been accompanied by three consolidations so far, all of which found their bottom above the 50-day moving average (light blue line). Since the break of the 2017 all-time high, the price has been moving around a trendline, which acts as support and resistance, respectively. A resulting regression trend over two standard deviations henceforth serves as an accurate indicator of the trend channel.
With today’s correction, Bitcoin is leaving the lower area of the channel and thus its trend line formed since the end of January, which has defined the uptrend since then. Also, Sunday’s trading session saw the first major break of the 50-day moving average (light blue line). , which so far serves as a good indicator of the bullish phase started since November.
The failed “retest” of the newly created support zone at 60’000 USD led to an initial selloff in the reporting week, which was potentiated by the break of important trend lines. Since reaching the 60’000 USD level for the first time at the end of February, a slowdown of the uptrend is visible. The departure from the parabola in the weekly interval (see macro) also speaks this language.
The structure of the rapid uptrend ushered in since the break of the historical all-time high at 20’000 USD in mid-December 2020 is taking damage. This does not necessarily mean a sign of a trend reversal in the first place, but the bears are likely to have a say in market events more often again in the future. The first indicator of the market condition is the 50-day average, followed by the support zone 50’000 USD.
For the time being, the resistance at 60’000 USD will be a big hurdle for the bulls and the new expected more cautious market environment could be negated for the time being only with a recapture of this zone.
Macro: End of parabolic price discovery in sight
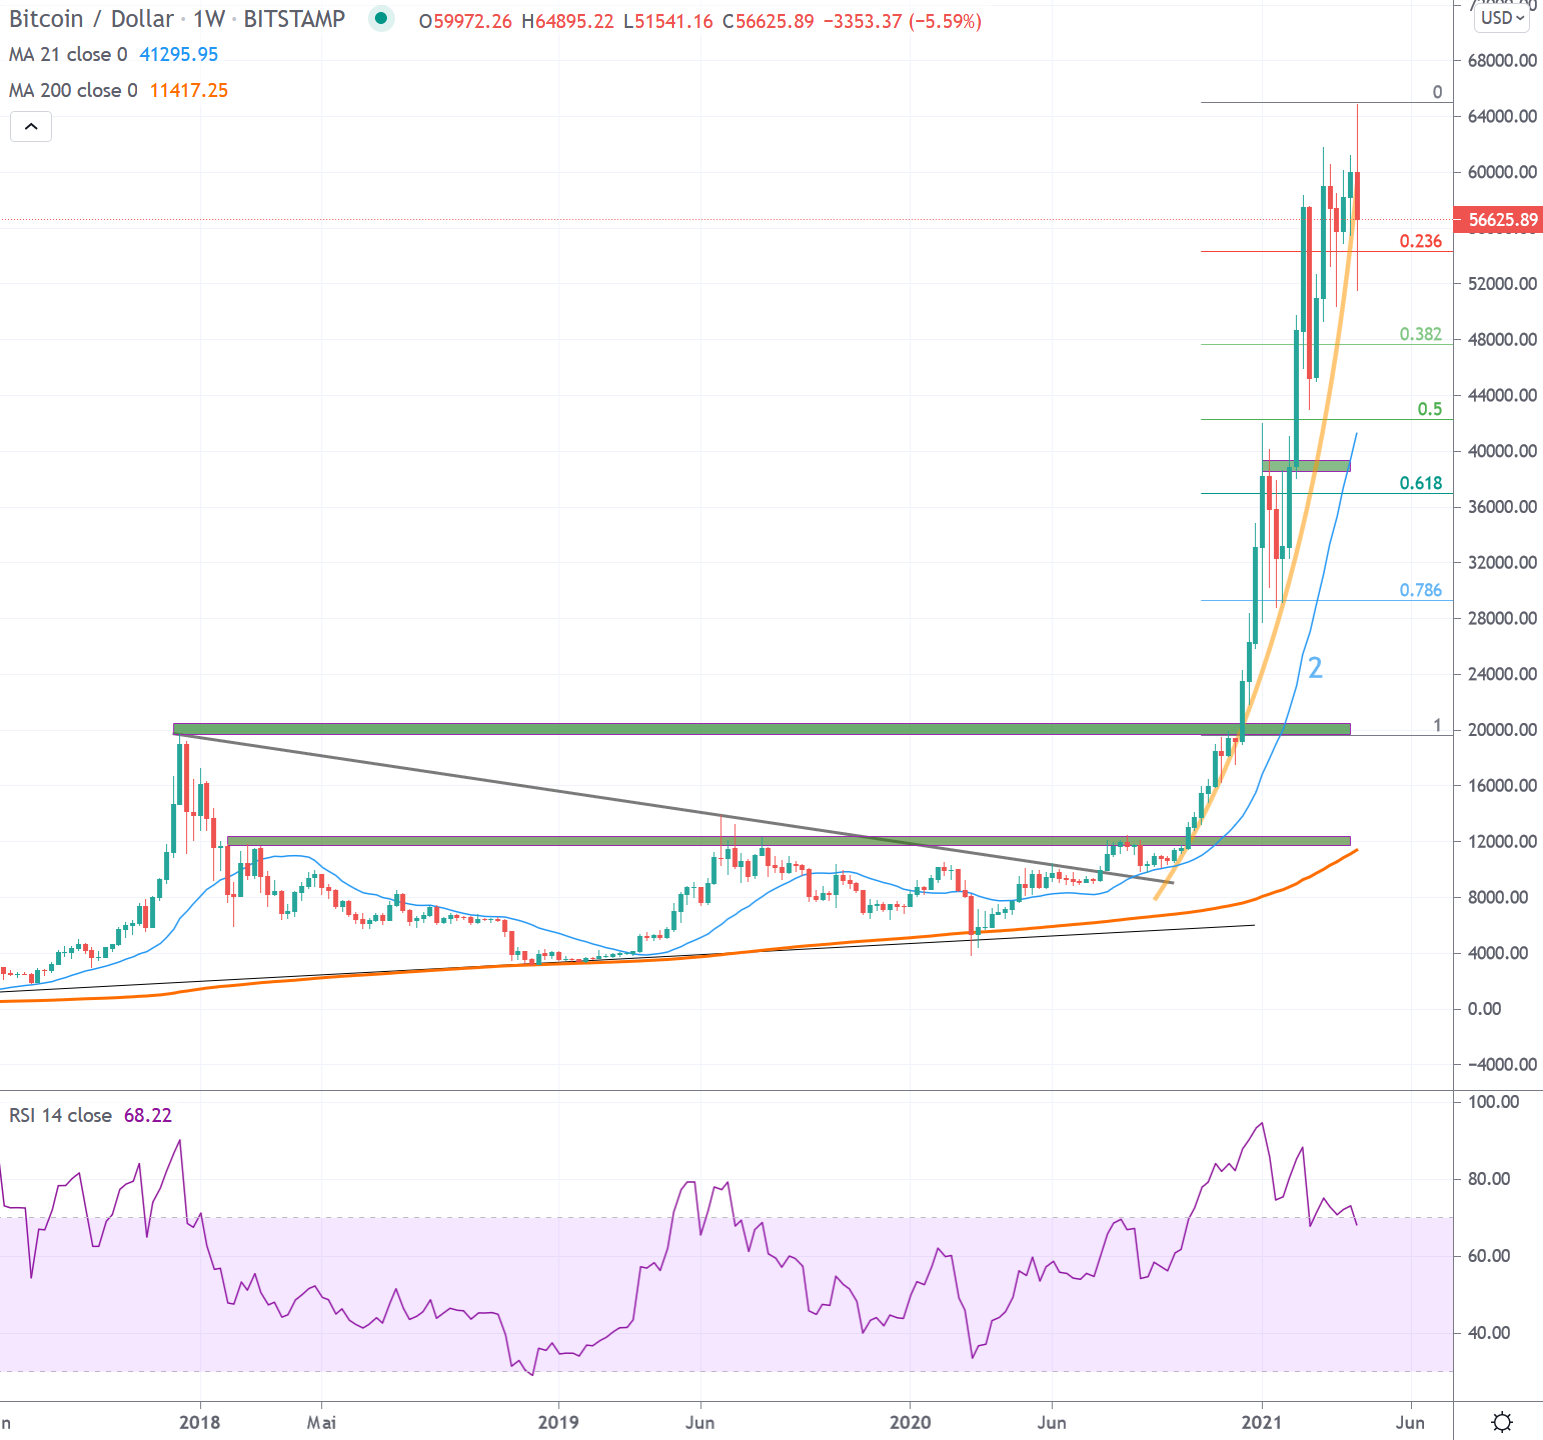
Bitcoin was able to set a higher high above 10’000 USD for the first time in the weekly interval in 2020, which broke the prevailing bearish trend since December 2017. This broke the series of lower highs that lasted for 135 weeks (1).
Since the break of the bearish trend, signs of a valid trend reversal have been building up. With the push through important resistance zones and a continuous development above the 21-week average (2), the probabilities for a renewed reaching of the all-time high created in 2017/18 increased. This was accomplished in mid-December 2020. Since then, a strongly accentuated price discovery above this mark has been taking place.
With the price movements in the past year, a good foundation was created to sustainably climb new spheres beyond the all-time highs reached in 2017. The break of the 20’000 USD mark impressively demonstrated the power of the upward movement that had been established since October. It resulted in a parabola (yellow), which has been showing clear cracks since the reporting week. Bitcoin’s parabolic price discovery mode could thus come to an end. This would indicate a future slowdown of the upward movement and makes further and longer-lasting corrections more likely.
In case of an incipient continued price correction, a respect of the previously created supports (green) over the next weeks/months will be necessary to make the initiated price discovery phase sustainable. The support zone at 39’000 USD, formed by the one-month march stop at the beginning of the year, remains to be observed. In this zone, there is also the 21-week average (2), which could reliably indicate bull and bear phases so far.
*Originally posted at CVJ.CH
Disclaimer
All information in this publication is provided for general information purposes only. The information provided in this publication does not constitute investment advice and is not intended as such. This publication does not constitute and is not intended as an offer, recommendation or solicitation to invest in any financial instrument, including cryptocurrencies and the like. The contents contained in the publication represent the personal opinions of the respective authors and are not suitable or intended as a basis for decision-making.
Risk notice
Investing in cryptocurrencies, is fundamentally associated with risk. The total loss of the invested capital cannot be excluded. Cryptocurrencies are very volatile and can therefore be exposed to extreme price fluctuations in a short period of time.
