Skip to content
  • Home
  • More
    • Enterprise Services
    • Affiliate Program
    • Official Links
    • About
  • MachinaAI

    Login
    • Home
    • News
    • Dashboard
      My Dashboard Equity Dashboard Analyst Dashboard Large Companies Portfolio
    • Smart Reports

Simplify financial decision-making

Machinary offers a modular and customizable solution that provides advanced financial news and statistical analysis. Our platform goes beyond traditional quantitative analysis, offering users a comprehensive understanding of real-time market dynamics, event detection, and risk analysis.


Register now and get free Credits

Sign up

Know the Market. Stay Ahead.

Market Insights & Analytics.

Gain access to a comprehensive retail platform with real-time updates on the stock market and critical financial metrics. Leverage advanced tools for better decision-making:

  • Overview of stock market data:Stay updated with the latest market trends and performance.
  • Monitor AI-based predictions:Access detailed company analytics.
  • Sentiment Analysis:Understand market emotions with AI-driven sentiment insights.
  • Relevance Score:Prioritize information that matters most.
  • Chatbot Integration:Get instant answers and insights through smart AI.
  • Customizable Widgets:Add or remove widgets to tailor your dashboard.
Sign up for early access

Stay Informed. Act Strategically.

Real-Time News Portal.

Unlock actionable insights with categorized, real-time news updates tailored to your needs. Stay ahead in the market with a reliable flow of information:

  • People:Explore updates about key influencers and market leaders.
  • Public Companies:Stay informed on listed corporations and their market activities.
  • Non-Public Companies:Gain insights into the operations of private enterprises.
  • Countries:Understand regional economic shifts and geopolitical trends.
  • Commodities:Monitor pricing and trends for critical commodities like oil, gold, and more.
  • Currencies:Keep track of currency fluctuations and forex market developments.
Sign up for early access

Modular Power. Limitless Potential.

Machinary empowered by MachinaCore

MachinaCore is a highly modular and scalable system that allows users to build custom widgets and tools tailored to their specific financial data needs, while seamlessly integrating with other MachinaLabs products, like Machinary, MachinaAI Modules and MachinaTrader.

Reaching new heights together.

Stay tuned for what’s coming next.

Exciting innovations are on the horizon! Stay tuned as we unveil new advancements designed to empower smarter decisions and greater success in the fast-paced world of finance.

Sign up for early access

Explore tailored enterprise solutions - that make an impact.

Exciting innovations are on the horizon! Stay tuned as we unveil new advancements designed to empower smarter decisions and greater success in the fast-paced world of finance.

Get in touch

Machinary offers a groundbreaking, modular, and customizable solution that provides advanced financial news and statistical analysis. Our platform goes beyond traditional quantitative analysis, offering users a comprehensive understanding of real-time market dynamics, event detection, and risk analysis.

Links

  • Home
  • News
  • Dashboard
  • About us
  • Contact

Address

  • MachinaLabs AG
  • Viaduktstrasse 42
  • 4051 Basel
  • Switzerland

  • info@machinalabs.net
  • machinalabs.net

Newsletter

Subscription successful!

© 2025 by Machinary.com - Version: 1.0.0.0. All rights reserved

Layout

Color mode

Predefined Themes

Layout settings

Choose the font family that fits your app.

Choose the gray shade for your app.

Choose the border radius factor for your app.

Save settings

Welcome to Machina, a platform to connect with the social world

Forgot Password?

Don't have an account?Sign Up

Welcome to Machina, a platform to connect with the social world

Already have an account?Login

  • Home
  • More
    • Enterprise Services
    • Affiliate Program
    • Official Links
    • About

Market review calendar week 8 – 2021

  1. Home
  2. Uncategorized
  3. Market review calendar week 8 – 2021
Bitcoin_Analysis_Week_37
  • crypto-valley-journal
  • 2021-02-25
  • Uncategorized

A summarizing review of what has been happening at the crypto markets of the past week. A look at trending sectors, liquidity, volatility, spreads and more. The weekly report in cooperation with market data provider Kaiko.

The last 7 days in the cryptomarkets:

  • Price Movements: Following historic all time highs and declining intraday volatility, Bitcoin and Ethereum crashed precipitously Monday morning.
  • Trading Volume: The falling ratio of U.S. Dollar to Tether volume suggests institutional traders have taken a step back in February.
  • Order Book Liquidity: Market depth plummeted during this morning’s crash, briefly causing a flash crash for ETH-USD on Kraken.
  • Volatility and Correlations: Bitcoin’s correlation with Gold has been mostly positive over the past 2 years.

A historic milestone followed by a sharp correction

Going to press, BTC and ETH plummeted, but the past week’s noteworthy events are worth mentioning. A series of seemingly endless new all time highs propelled Bitcoin’s market cap past the $1 trillion milestone, up from $178 billion a year ago. The bull run continued its spread to all sectors of the crypto industry, with Binance‘s BNB token experiencing the week’s best returns at 107%, catapulting the exchange token to a new ranking of third largest by market cap. The question on everyone’s mind is whether this historic rally can keep up, especially considering trading volumes seem to be tapering off despite the highs. This morning suggests that a correction is in the works.

Dollar volume as an indicator of institutional inflows

Source: Kaiko

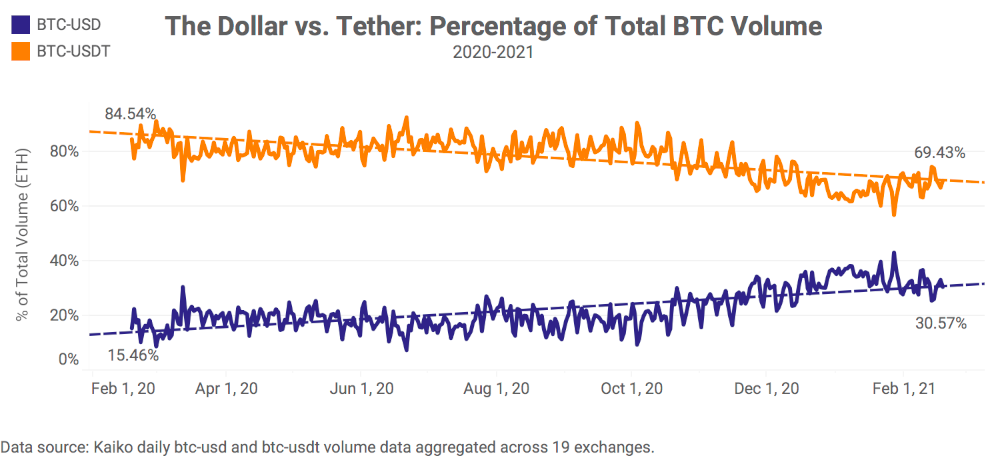
The ratio of Dollar (USD) volume to Tether (USDT) volume can be used as a signal of institutional participation in crypto, assuming that most institutional traders prefer to transact with fiat currencies on regulated exchange platforms. Since last year, Dollar volumes have doubled from 15% of the total Bitcoin traded to 30%. This rise corresponds closely with the wave of institutional announcements made over the past few months. USD volume peaked mid-January at more than 40% of the total.

We can also use this volume ratio on shorter timescales to determine how institutional traders are behaving. Below, we charted USD and USDT volumes over the past two months, and can observe a different trend compared with the chart above.

crypto markets review
Source: Kaiko

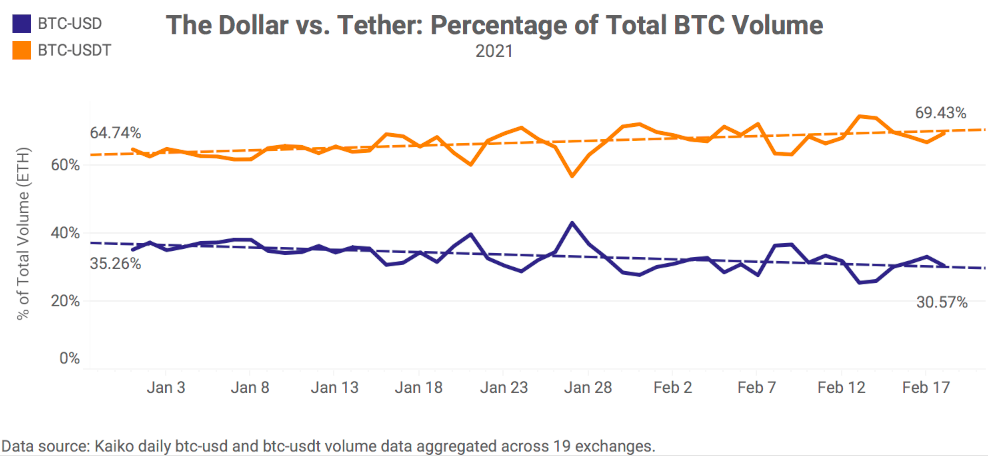
In the short term, the volume ratio suggests that institutional buyers have taken a pause in February, with a 5% decline in BTC-USD volume relative to BTC-USDT. Interestingly, prices have continued to rise to new all time highs despite the shift in the volume ratio towards more retail, crypto-only exchanges such as Binance. This suggests that institutional traders have played less of a role in Bitcoin’s rally over the past few weeks.

Market depth dissolves during a crash

crypto markets review
Source: Kaiko

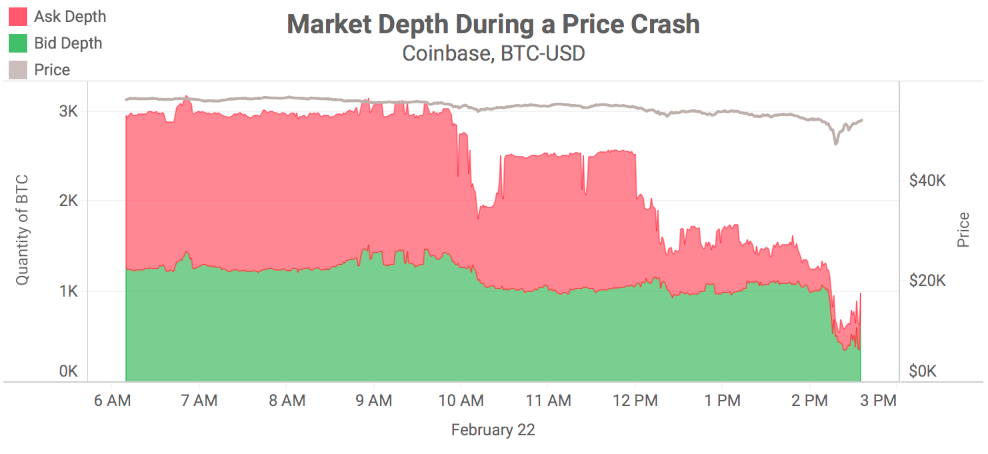
This morning, prices went haywire. From one minute to the next, Bitcoin bounced between $48k, $52k, and back to $48k. It seemed that price feeds were broken, but what was actually happening was that a complete decimation of order book depth made the process of price discovery near impossible. When there is no market depth remaining on an order book, there is nothing stopping large market orders from whipsawing the price of Bitcoin. In extreme scenarios, this can cause what is known as a flash crash, which is when the withdrawal of orders amplifies price declines.

crypto markets review
Source: Kaiko

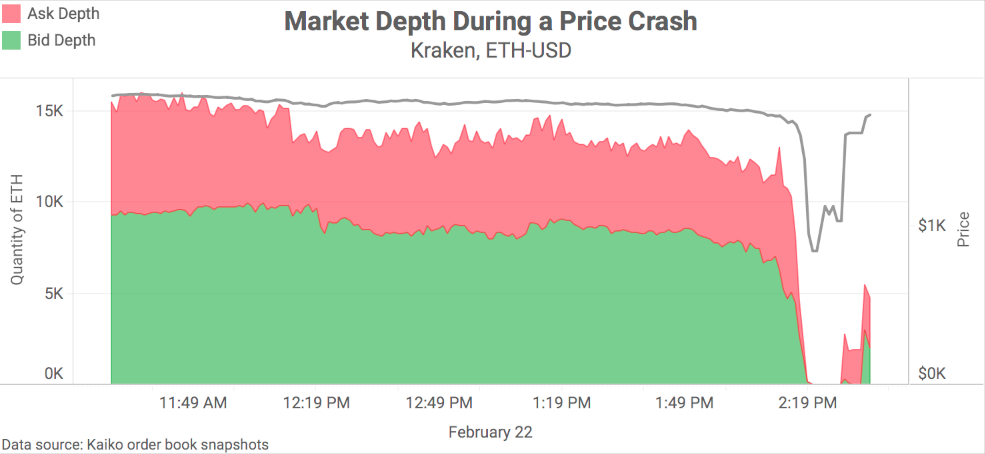
A flash crash actually occurred briefly on Kraken this morning for ETH-USD markets, which saw the price of ETH plummet below $1k (it had traded at $1600 moments earlier). We can observe above a complete decimation of market depth, as market makers quickly pulled orders from the book. This temporarily caused prices to plummet, only to rebound once market makers adjusted their positions.

Bitcoin’s correlation with gold has been mostly positive over the past 2 years

Source: Kaiko

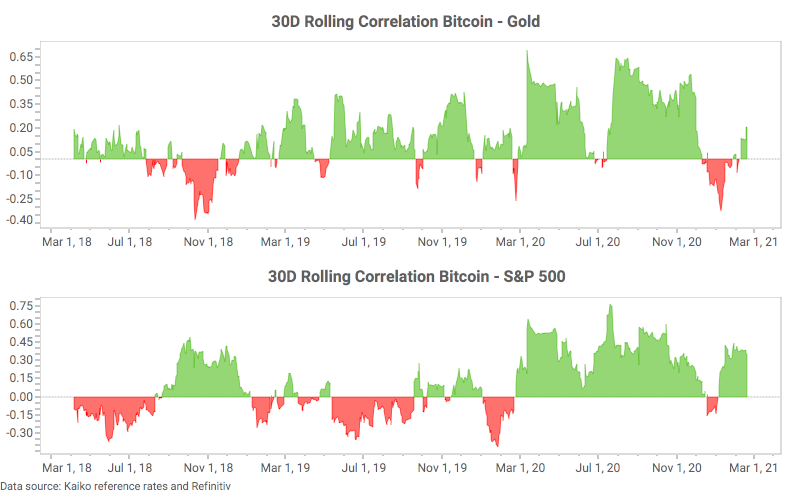
On the other hand, Bitcoin’s correlation with the S&P 500 has only been consistently positive over the past year, likely due to pandemic-induced economic shocks. No matter, both correlation charts show that nearly all financial assets (gold, equities, and crypto) have benefitted over the past year, for different reasons. Bitcoin and gold are often considered hedges against economic shocks and inflation, which could explain their growth, while many believe equities have soared as a result of business-friendly fiscal and monetary policy.

*Originally posted at CVJ.CH

  • Tags:
  • Bitcoin
  • BTC
  • market analysis
  • price analysis

Leave a Reply Cancel reply

You must be logged in to post a comment.


 MachinaTrader

A new era of trading and data analytics

Everything in one place. Highly reliable, ultra-scalable and blazingly fast!

Related Links

News Blog
Forums
FAQ
About
Privacy Policy (DSGVO/GDPR)

Our Partners
sygnal logo 40
bullishtimes logo white
© 2023 MachinaLabs AG. All Rights Reserved.
People Who like this post
  • img
img