Depth and Duration of the Bitcoin Price Bear Market – Elliott Wave Analysis
Part 1 of this series of analysis articles introduced Elliott Wave Principle (EWP). The core assumption is counter-intuitive, at first:
The Wave Principle argues that markets are not driven by fundamentals or news, but instead by “social mood” – the collective psychology of all market participants.
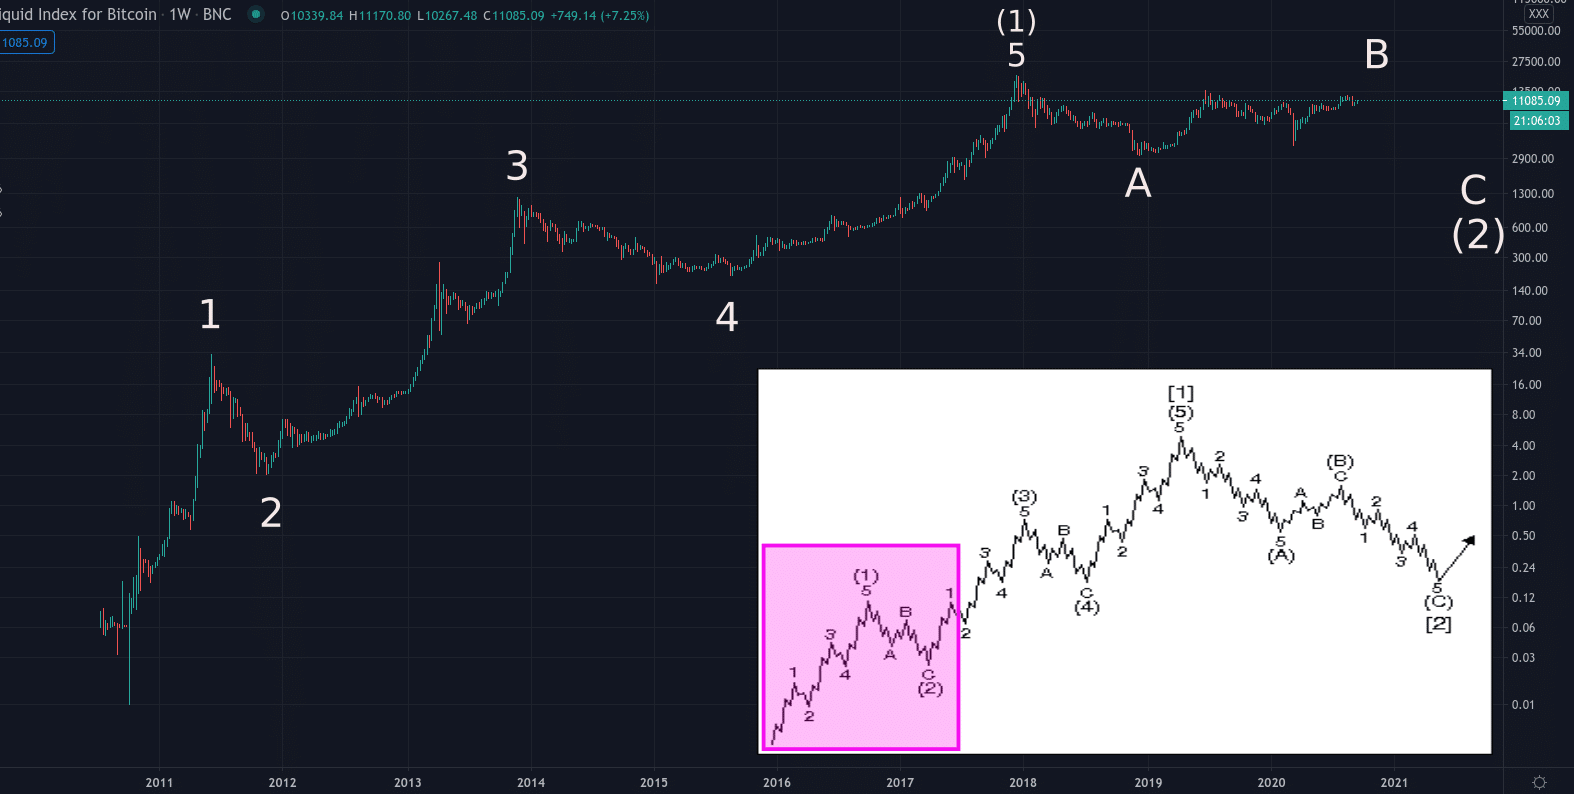
Be sure to read Part 1 so you may understand this article’s application of EWP to the long-term bitcoin price chart. Recall the wave count that was proposed in part 1:

Historical Bitcoin Price Chart Overview
Since 2010 when bitcoin was first traded we can see five waves up to the 2017 market top. Looking at the inset diagram of idealized EWP market structure, the completed five wave sequence is labeled (1).
The EWP expectation is that three large degree waves should now unfold to a bear market low at label (2).
After wave (2) has completed we then move out of the magenta box as advance progresses in wave (3) – a prolonged bull market that should be larger than the initial wave (1) we saw up to the 2017 high.
All fair and well, you might be thinking, but how do we know when a wave is complete? Do we simply put arbitrary labels at tops and bottoms and hope that we are correct? Fortunately, EWP is more thorough than merely slapping subjective labels on a chart. To truly apply EWP we must acknowledge that market price is fractal in nature and that waves of price action unfolds as ratios of preceding waves. Specifically, the Wave principle requires us to identify Fibonacci ratios in the chart, since this is the subconscious guide of human psychology.
Fibonacci Ratios Everywhere
Our minds find certain ratios pleasing, whether in architecture, in a painting, in music or in charts. The most pleasing ratio – the Golden Mean of 0.618 – is a key Fibonacci ratio. This Golden Mean and other Fibonacci ratios, such as 0.382 and 0.89, manifest pervasively in nature and in all human endevors, including collective projects, such as development of civilizations and… market price charts.
Through the study of tens of thousands of price charts, EWP practitioners have found that each price chart tends to have its own “personality” – with each market tending toward certain Fibonacci ratios which then repeat at larger and smaller timeframes – the fractal “fingerprint” of that specific price chart. Next, we will consider the Fibonacci ratios that characterize the bitcoin price chart.
Ratio Analysis of Bitcoin Price

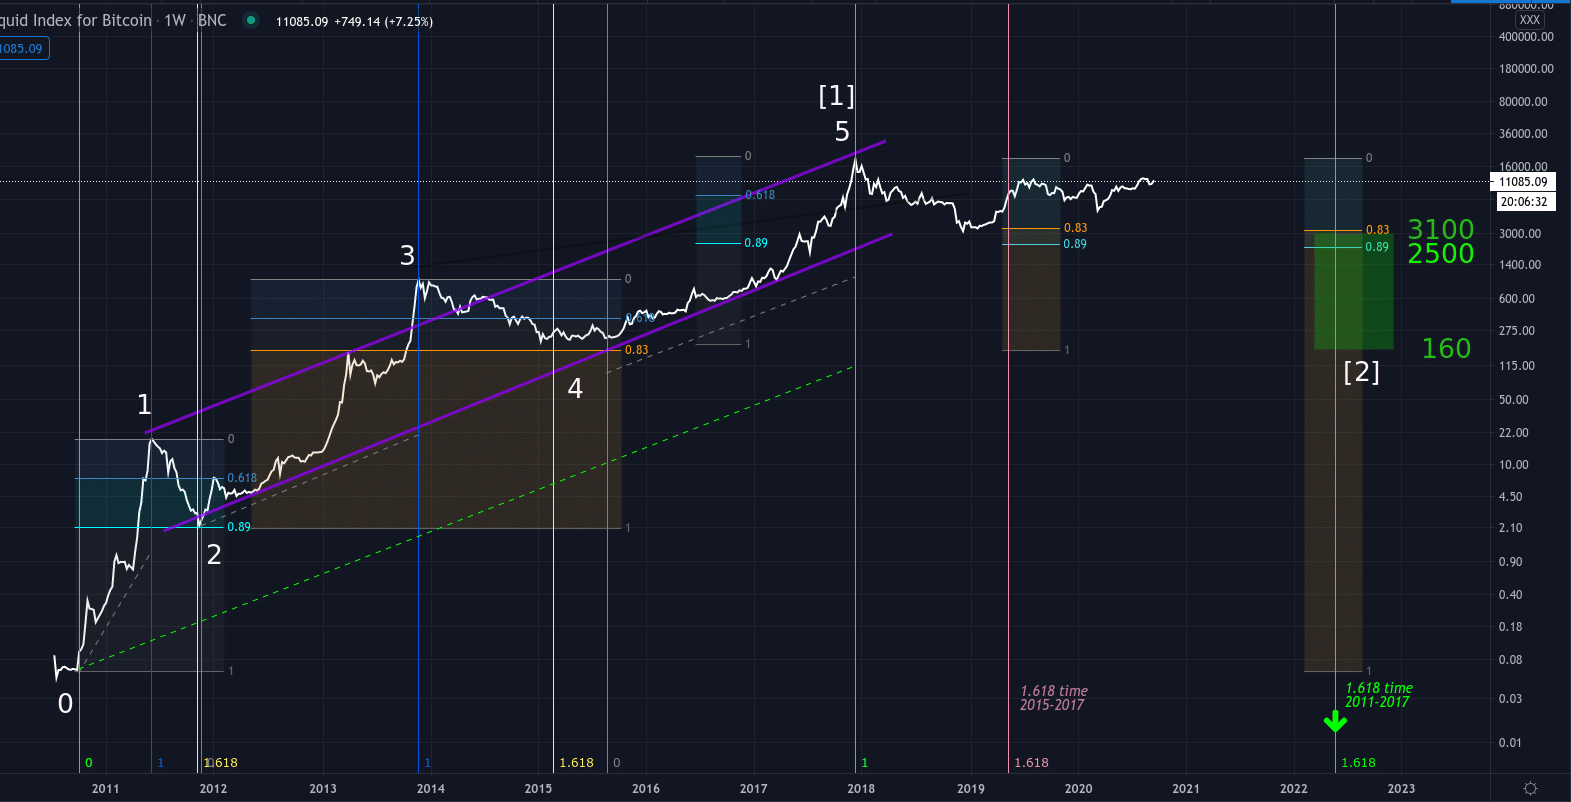
For now, ignore the vertical lines in the chart and focus on the white wave labels 1, 2, 3, 4 and 5. Have a look.
Notice that the five price waves unfold in a parallel channel – the diagonal purple lines. This is a key EWP requirement, namely, that five consecutive waves should have touch-points in a parallel channel. Waves 3 and 4 tend to exceed the channel boundaries, and we can see that wave 3 tops out above the channel, but waves 4 and 5 confirm the parallel channel that defines the five wave sequence.
Let’s go to wave 1 in the far left of the chart. A Fibonacci retracement tool is drawn from the bottom to the top of wave 1. Wave 2 retraces 0.89 of the distance of wave 1. This can be verified at the light blue marker 0.89.
Next, look at wave 3 and the 0.81 (orange) retracement made by wave 4. Not a Fibonacci ratio and not the perfect 0.89 corrective low we expect, but close enough, considering that the 200 week moving average (a powerful support) was at $210 at the time and halted further decline. Note that we are measuring the distance of wave 3 between label 2 and label 3. It is typical for fourth waves to retrace to a shallower depth than second wave retracements.
So we see that bitcoin price tends to correct 81% to 89% of its long-term advances.
Next, wave 5 measured from label 4 to the top at label 5. The Fibonacci tool drawn across wave 5 shows that the bear market of 2018 had retraced 0.82 (orange marker) of wave 5. In the popular conception, the bear market has achieved its typical depth (>80% correction) and, therefore, bitcoin price must be in its next phase of advance. Right?
Two key EWP rules shed light on the market’s future development:
- After five waves have unfolded in a channel, the market has completed a larger degree wave. In this case the large degree wave is labeled [1] at the 2017 top. Next, a correction of similar large degree must complete. This large correction will be wave [2]. Refer to the inset in the first chart, above, for context.
- Given the fractal nature of price charts, We would expect the characteristics of small degree wave 2 (far left of the chart) to repeat in the larger degree wave [2]. This should include its depth of retracement (0.89 of wave [1]) as well as its duration.
Fibonacci Time Analysis

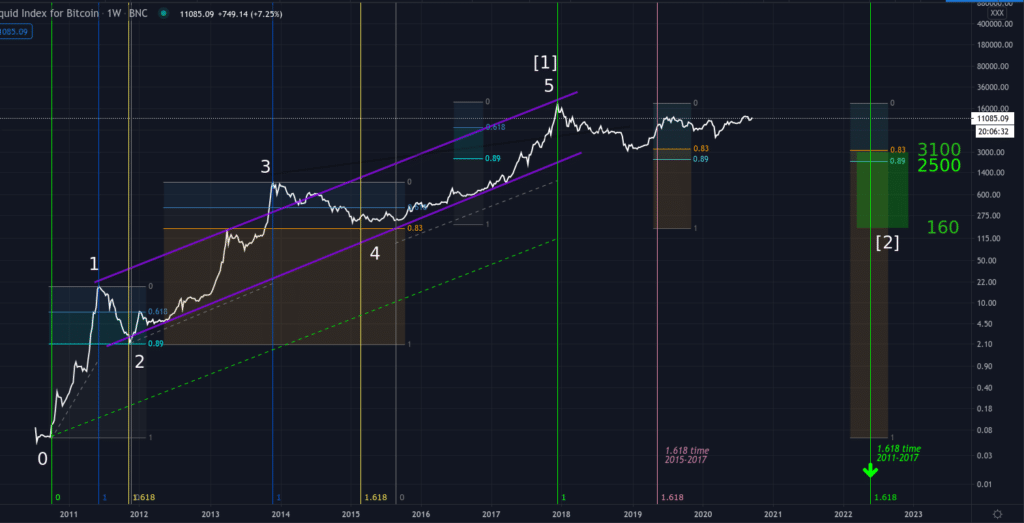
Note: this is the same chart as bove, posted here for ease of reference
Just as we can measure distance in terms of Fibonacci ratio, we can also measure time duration of waves. We will now consider the vertical lines in the chart.
Look in the far left of the chart at the vertical green line at the inception of bitcoin price. The time duration of wave 1 is measured from the green line to the blue line. This distance is calibrated as having a value of 1. This distance is projected by its Golden Mean ratio (0.618). The yellow line marks the time duration of wave 1 plus 0.618. Notice that this time marker is also the bottom of wave 2.
Applying this Fibonacci time projection to the duration of wave 3 (measured from label 2 to label 3) the 1.618 time marker designates the period of wave 4 lows in 2015.
To illustrate the EWP rule that a large degree correction unfolds after a five wave sequence, this time analysis is also applied to wave 5. The 1.618 marker of the duration of wave 5 designates the bear market low in early 2019. But we can see that this is not the case. The pink 1.618 line is irrelevant because we know to expect a correction of the entire five wave sequence.
Measured from the green line in the far left of the chart all the way to the top of wave [1] (middle of the chart) the 1.618 time projection is designated in 2022 by the green vertical line in the right of the chart.
Elliott Wave Analysis Conclusion
In other words, given the bitcoin price chart’s tendency to correct to a depth of 80-90% of the preceding wave, and to complete such correction at 1.618 of the duration of the advancing wave, EWP predicts a wave [2] bear market low in the first half of 2022 at a price of $2,500 BTC/USD.
This is the reasonable expectation of EWP analysis. While the time marker should be quite accurate, the exact price level is not so easy to predict. At the very least a double bottom near $3,100 is possible, with the median expectation being $2,500. However, panic selling may spike price as low as the bottom of wave 4, near $160. This would not violate any EWP rules or guidelines and is in keeping with the extreme emotionality of bitcoin price wave tops and bottoms.
Use this analysis as guidance. Do not act on it in isolation. We do not know by which route price will achieve that eventual market low. Every trader must find a method and practice of trading that they understand from first principles. Combine this analysis with your own and you should find that you will be able to time the future bear market bottom better than simply reading daily analysis on Twitter and following the consensus view.

