
Bitcoin USD daily basis
Bitcoin USD Chart Analysis – Breakout above consolidation level at 24’000 USD leads to 28’000 USD
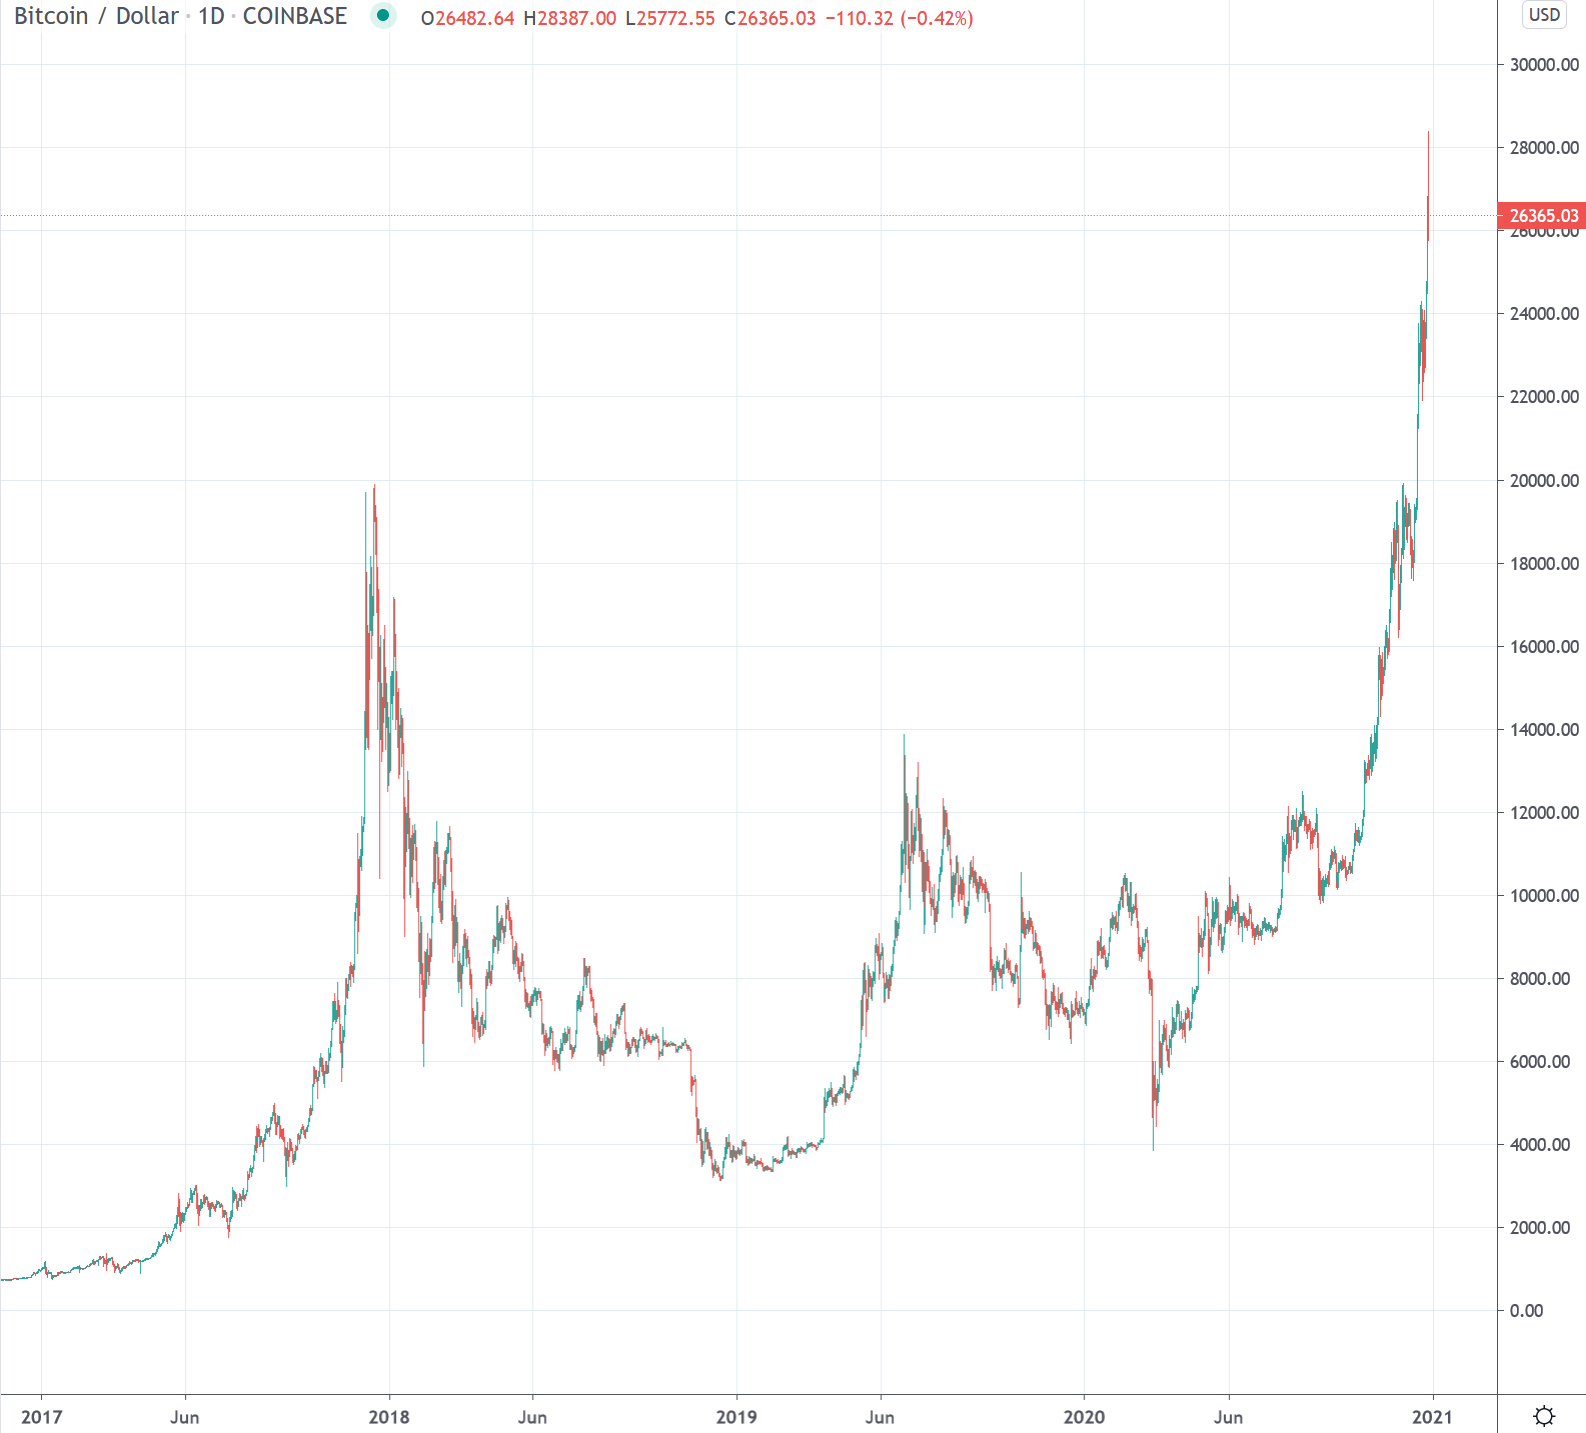
The last week of the old year was once again a very eventful one. The pace of price increases was accelerated a bit further. But one thing at a time. We remember: The previous week was marked by a two-day bull run, which catapulted Bitcoin from 20,000 to just short of 24,000 USD. This was followed by a 7-day period of consolidation below the 24,000 mark. Accordingly, Monday of the reporting week was day 4 of the mentioned consolidation and characterized by losses, which led the price back to the area of 22,000 USD at the day’s low. At the end of the day, as well as during trading on the subsequent day, rising prices could already be seen once again and thus Bitcoin was able to exit trading on Tuesday basically at the daily high of 23,850 USD. Wednesday and Thursday were characterized by lower daily lows and daily highs, with trading continuing below the 24,000 USD zone. On Christmas Day, however, the time had come and persistent buyers brought the price above the recently created resistance to 24’700 USD. St. Stephen’s Day was not inferior to the previously launched new bull market and recorded the highest gain of the week with a jump of over 7%, bringing Bitcoin already to 26’400 USD. On Sunday, again, it looked as if the market wanted to continue the trading pattern of the previous days. The trading action first led Bitcoin to a new all-time high above USD 28,400. However, profit-taking set in during the second half of the day and brought the price back to the USD 26,000 mark. The result was a healthy weekly gain.
Exuberant price discovery in new territory
Review Daily Interval
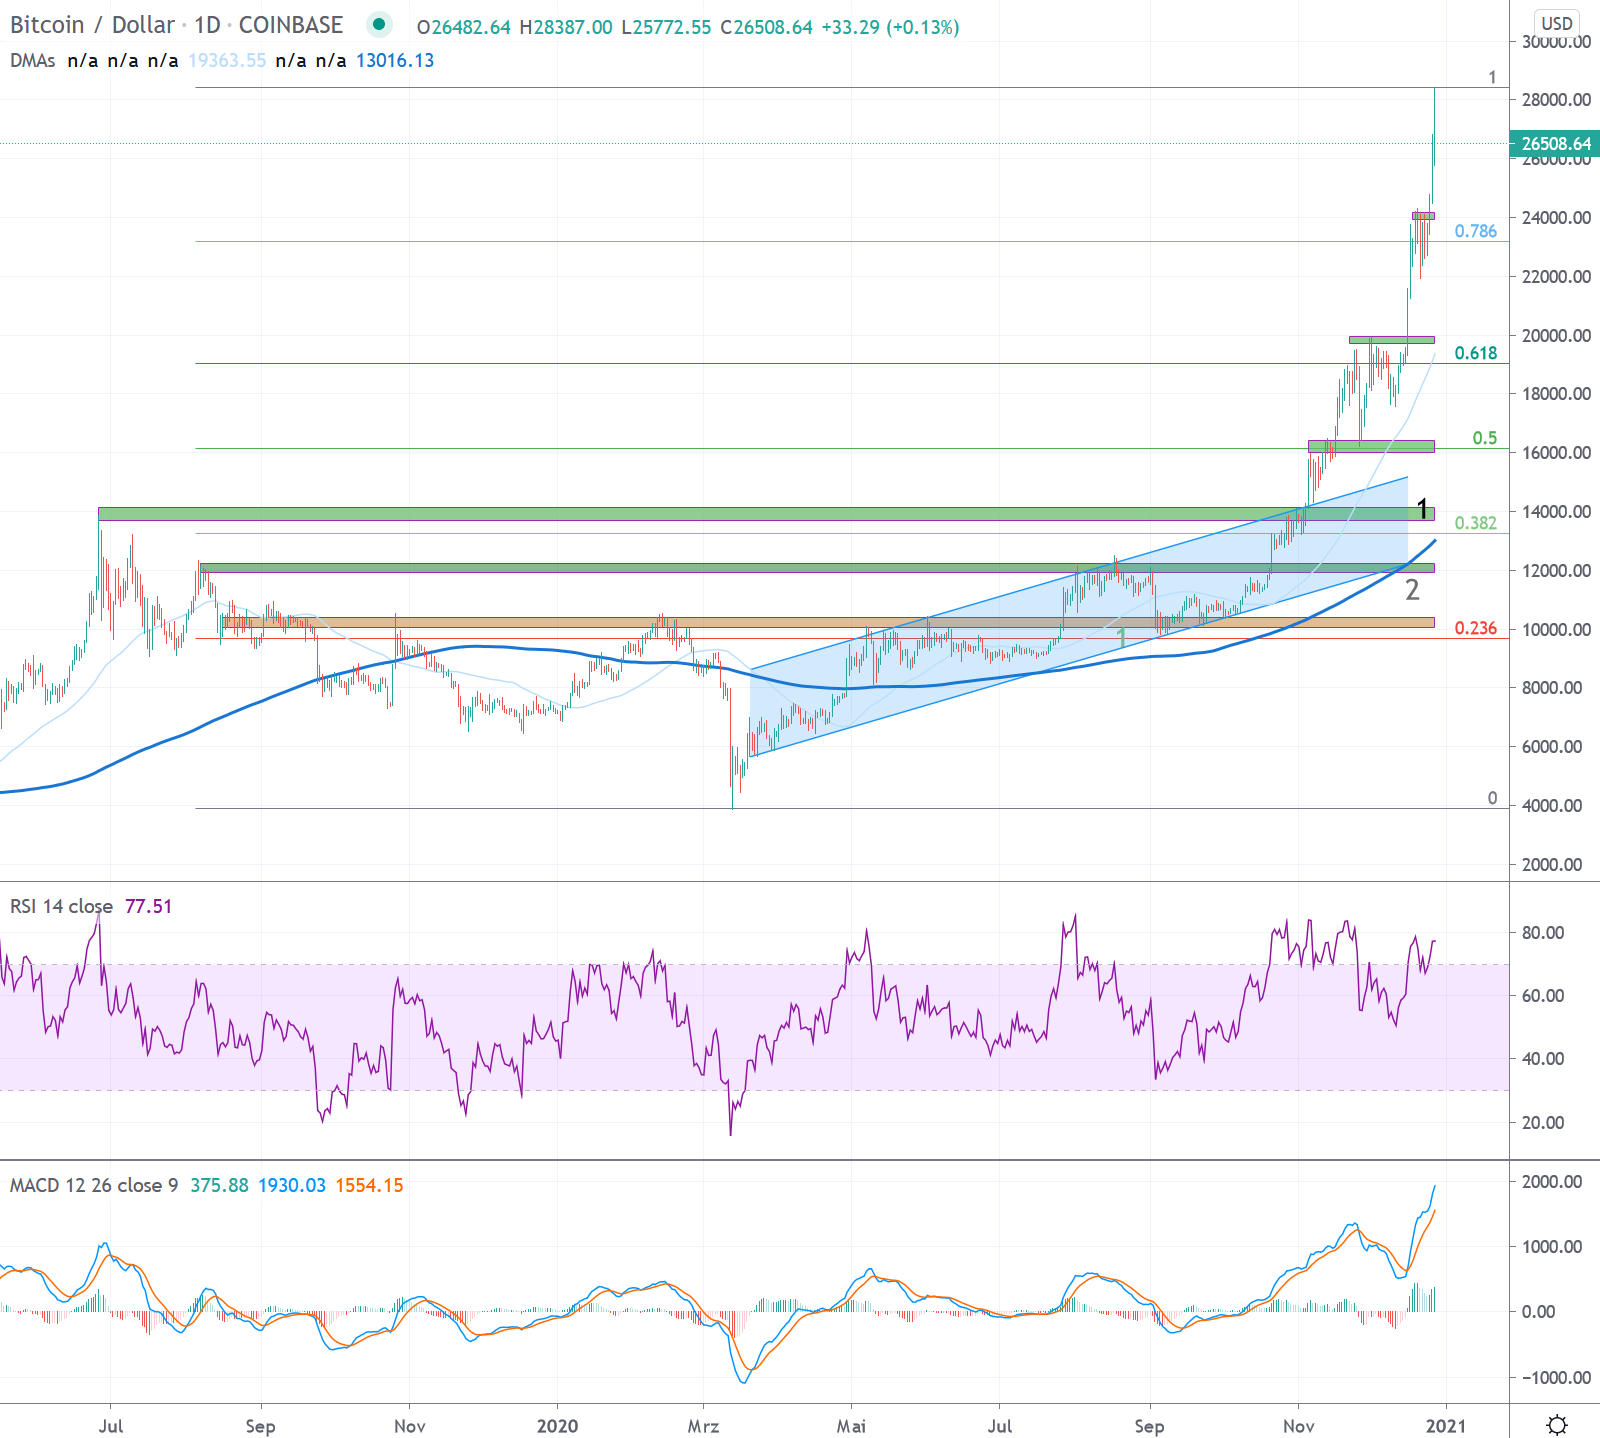
A veritable countermovement established itself after the price slump in mid-March. This led up to the resistance zones starting at USD 10,000. After a renewed rejection at the beginning of June, an almost two-month consolidation was observed. This was characterized by a series of higher daily lows and lower daily highs. The series of lower highs was broken on 22 July. This was followed on July 27 by a break through the resistance zone around USD 10,500, which has been established since August 2019 and which Bitcoin has already failed to break several times.
The resistance zone around USD 10,000 was interesting in several respects. On the one hand, it contained the 0.618 Fibonacci point of the entire downtrend, which was heralded at the end of June 2019 just below USD 14,000. On the other hand, the zone around USD 10,000 simultaneously served as a confirmation of the still bearish trend of lower highs since December 2017 (see next section). This zone now counts as a significant support (green).
Bitcoin has been able to establish itself above the newly created support in the USD 10,000 zone since the end of July. This support was confirmed by a re-test in early September and has since then served as the beginning and important pillar of the recent positive trend. Since then, further significant resistance zones have been overcome. On October 21, for example, the resistance zone around USD 12,200 was breached, which was established as early as January 2018 and has served as the zenith for the Bitcoin price on several occasions thereafter (see macro outlook). In the following weeks, the positive trend intensified and led Bitcoin to the “last visible resistance” at USD 14,000, before the all-time high.
At USD 14,000, an important resistance that stood in the way of a “clear sky” scenario up to the all-time high was passed. An impressive act of strength and a first-class proof that the market is serious about the trend reversal that has been initiated this year. The breakthrough was reinforced by the simultaneous break of the upper trend line of the trend channel that has been forming since March (light blue). This led to a strong accentuation of the uptrend from the beginning of November, which most recently brought the Bitcoin price in a parabolic rise to the all-time high of December 2017.
Outlook
Since the breakout of the important 14,000 resistance level, it has been going on in rapid fashion. After 14 days, a first approach to the then all-time high at 20,000 USD. After three weeks of consolidation, another three-day price surge to 24’000 USD. After a 5-day consolidation, a renewed price fireworks in the reporting week led to a new all-time high at 28’400 USD. This represents a doubling of the price in 52 days.
Price discovery beyond the historical highs and thus in unexplored territory is the current market mode. In this phase, many things are possible. Resistances are thus nonexistent for the time being. Fibonacci friends might recognize the 1.618 point just below USD 30,000 as resistance, derived from this year’s low and the last visible resistance at USD 20,000.
For a sustainable establishment, the recently surpassed resistances should be respected as support in the coming weeks (green). The two short consolidation phases around 24’000 and 20’000 USD respectively serve as initial supports for the time being (green). This is followed by further support zones at 16’000 and the major support between 12’000 and 14’000 USD (1). At this point, help is provided by the intermediate high formed between April and June 2019 as well as the 200-day moving average (2).
Macro: New all-time highs
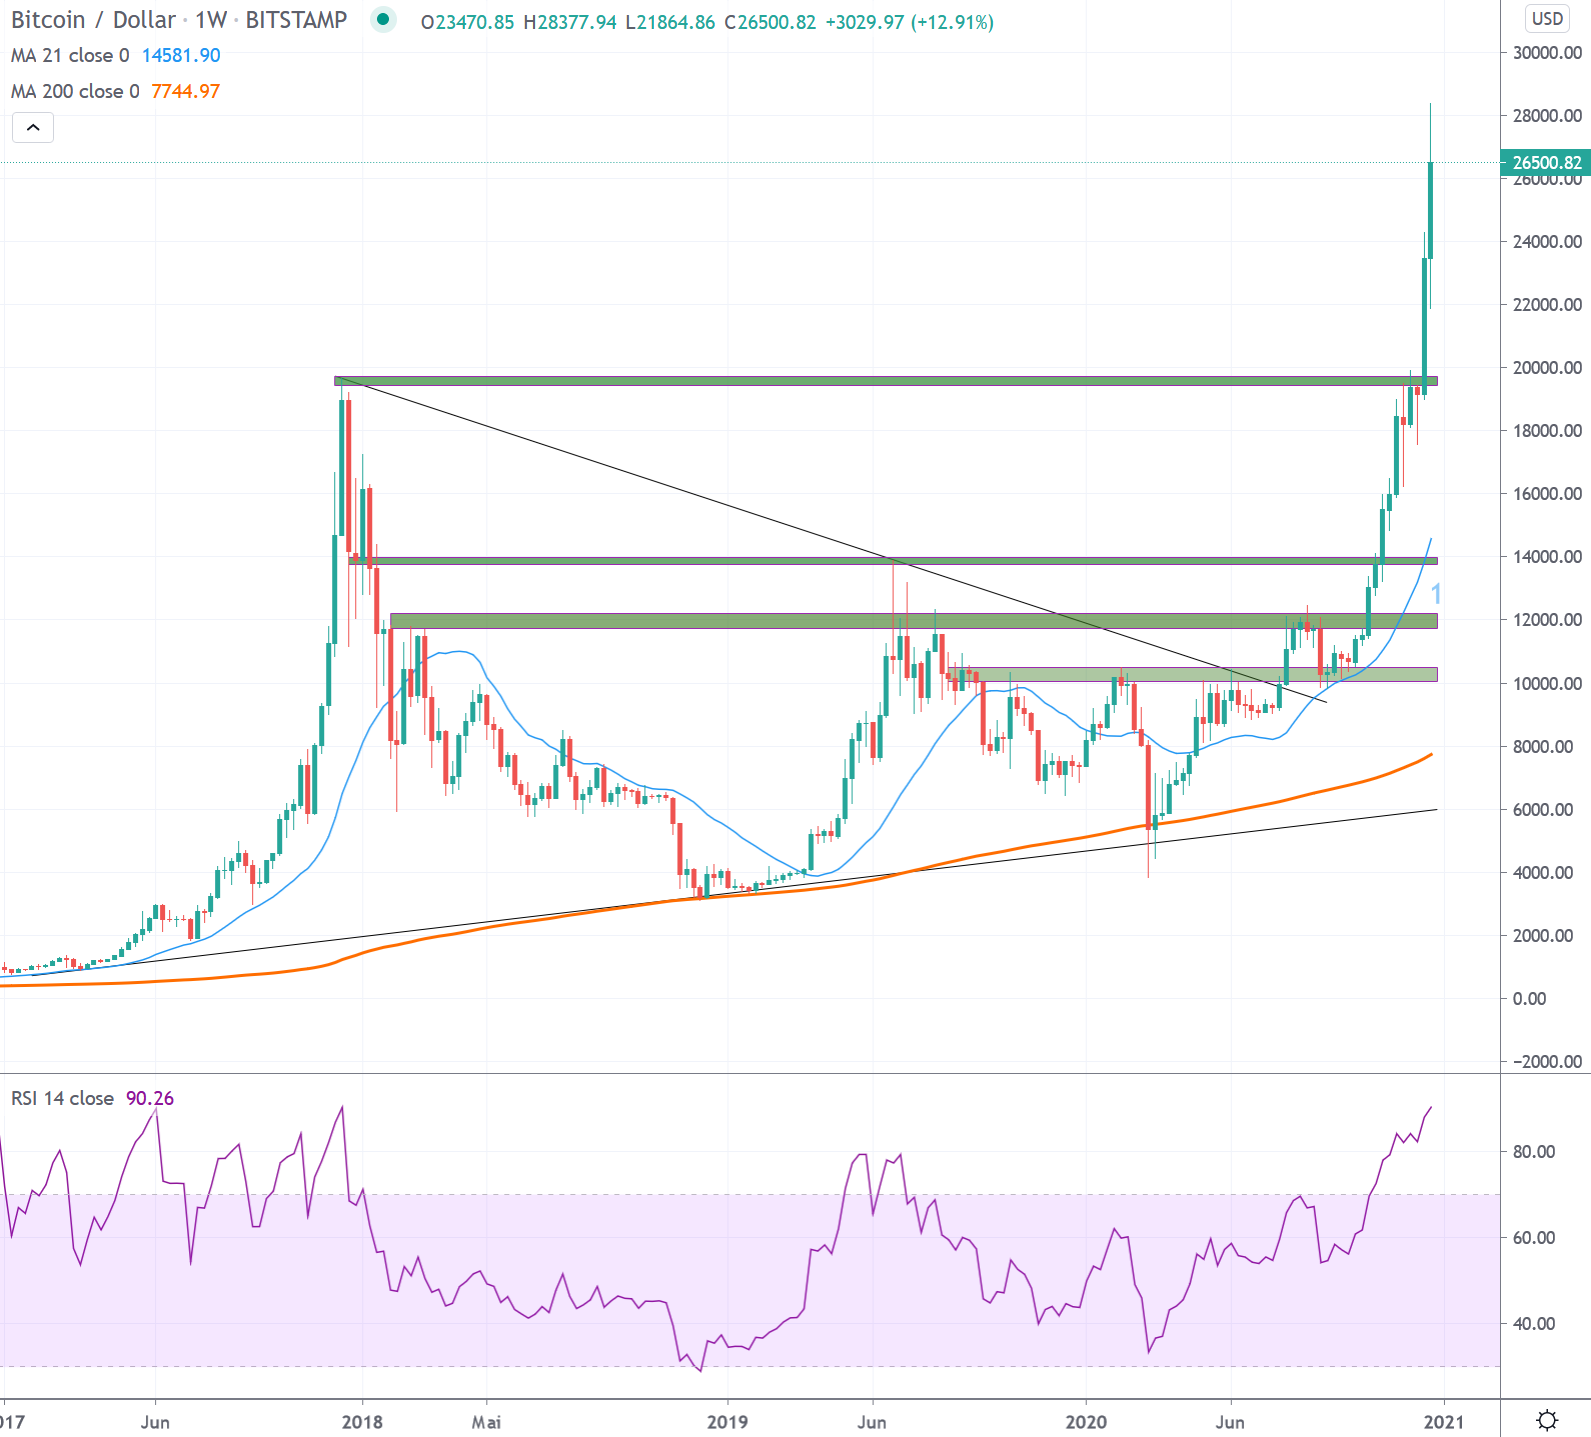
Bitcoin was able to set a higher high above USD 10,000 in the weekly interval for the first time in 2020, which broke the prevailing bearish trend since December 2017. This interrupted the series of lower highs that lasted for 135 weeks.
Since the break of the bearish trend, the signs of a valid trend reversal became stronger. With a push through key resistance zones and a steady trend above the 21-week moving average (2), the probabilities of a retest of the all-time high created in 2017/18 became higher. This was accomplished recently.
With last week’s price moves, a good foundation was laid to reach new spheres beyond USD 20,000. Corrections become more likely after accentuated price increases. In this context, sustained respect of the newly created supports (green) over the next weeks/months is required to decisively advance into new price spheres. The first support in the weekly interval is located at around USD 20,000. Significant is the support zone below 14’000 USD, which is characterized by historical price movements as well as the 21-week average (1).
*Originally posted at CVJ.CH
Disclaimer
All information in this publication is provided for general information purposes only. The information provided in this publication does not constitute investment advice and is not intended as such. This publication does not constitute and is not intended as an offer, recommendation or solicitation to invest in any financial instrument, including cryptocurrencies and the like. The contents contained in the publication represent the personal opinions of the respective authors and are not suitable or intended as a basis for decision-making.
Risk notice
Investing in cryptocurrencies, is fundamentally associated with risk. The total loss of the invested capital cannot be excluded. Cryptocurrencies are very volatile and can therefore be exposed to extreme price fluctuations in a short period of time.
