
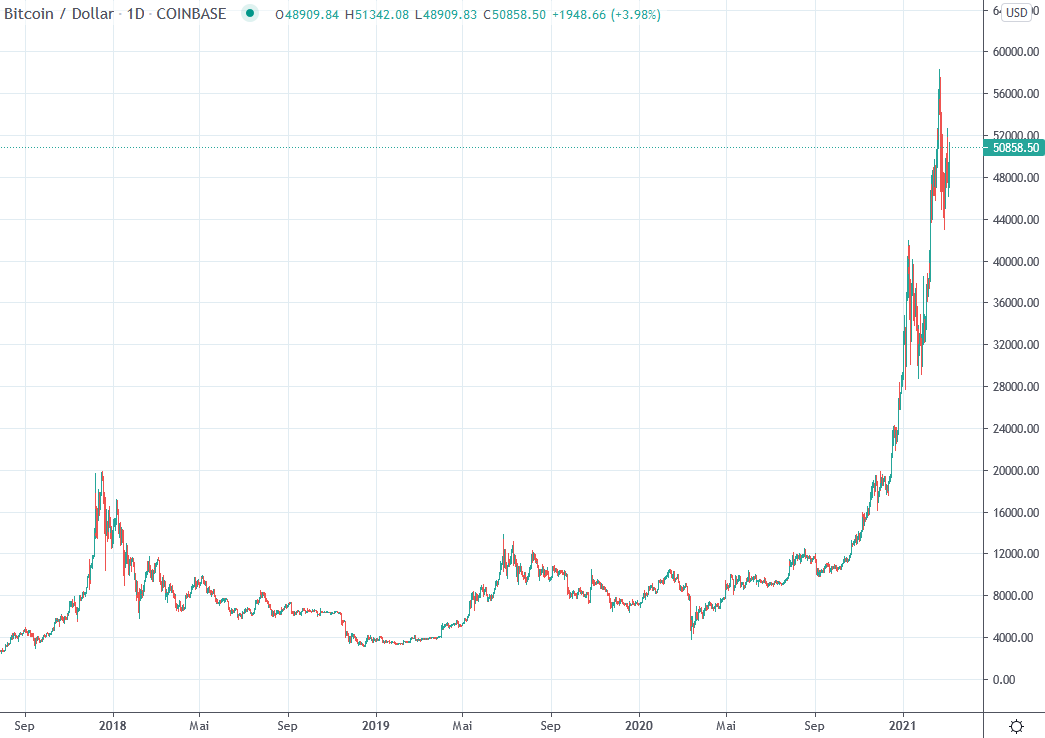
Bitcoin USD daily basis
Bitcoin USD Chart Analysis – Incipient Correction After New High
On Sunday, Bitcoin was able to break the one-week trend towards lower prices for the first time. Since the recent all-time high just below 60’000 USD, a consolidation set in during the previous week, which took the Bitcoin price to 43’200 USD at the low. The price increase on Sunday brought the price back to 49’700 USD at the end of the day, and thus above the level of the respective daily highs of the past 3 trading sessions. So, with this feedback from the bulls, the reporting week started and the main part of the trading activity of the rest of the trading days took place in a broadly inconsistent trend at the same level. Consequently, the price was also just above the 50’000 USD at the end of the week. The downward trend of the previous week was stopped sustainably.
Intact structure of the uptrend
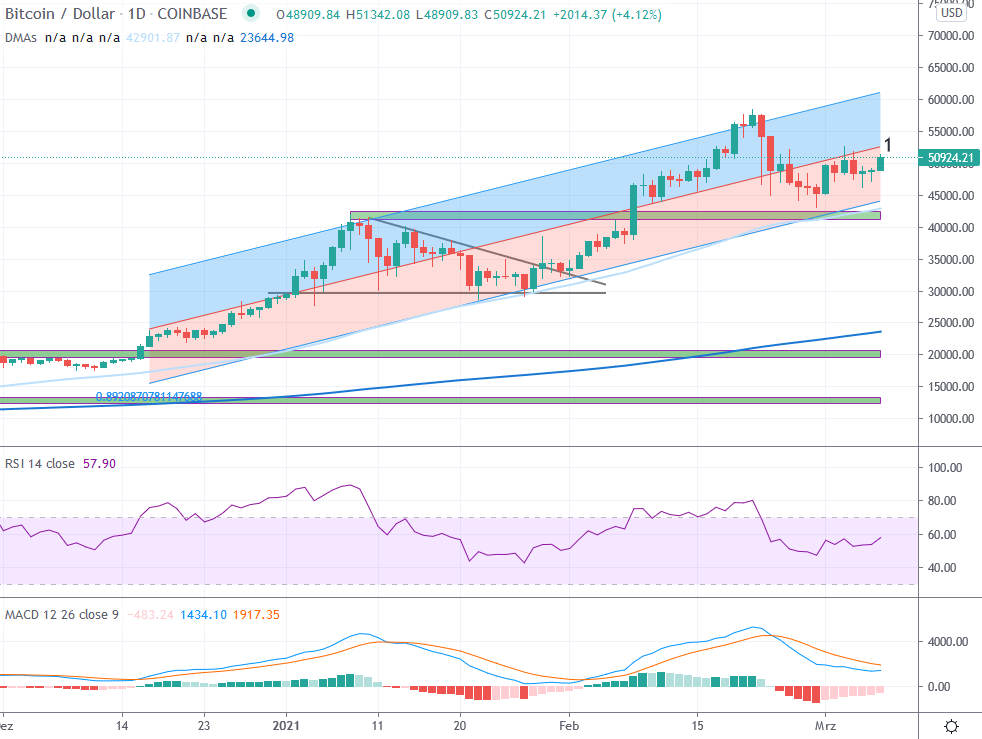
Review daily interval
After the price drop in mid-March 2020, a veritable countermovement established itself. This led to the resistance zones from 10’000 USD. After an initial rejection and a consolidation phase lasting almost two months, a breakout through the fundamental resistance zone followed on July 27, which had been established since August 2019 and had already caused Bitcoin to fail a few times to date.
The resistance zone around 10’000 USD was interesting in several respects. On the one hand, the 0.618 Fibonacci point of the entire downward movement, which was initiated at the end of June 2019 just below 14’000 USD, is located here. On the other hand, the zone around 10’000 USD simultaneously acted as a confirmation of the still bearish trend from lower highs since December 2017 (see macro view on a weekly basis). Bitcoin was able to establish itself above the newly created support in the 10’000 USD area since the end of July 2020 and provided a first confirmation of a trend reversal with the break of the resistance zone around 12’200 USD towards the end of October 2020. The aforementioned resistance zone had been effective since January 2018 and served as a zenith for the price several times since then. In the following weeks, the positive trend accentuated and led Bitcoin through the 14’000 resistance in early November 2020 and close to the then all-time highs around 20’000 USD for the first time in early December, which remained untouched for 158 weeks since the bull market in 2017.
Since the breakout through the important 14’000 resistance at the beginning of November, it has been blow by blow. The break through the old all-time high at 20’000 USD saw a strong accentuation of the uptrend. Subsequently, the price doubled in only 23 days. A first correction in the led the price back below the 30’000 USD. Thereafter, a renewed upward movement began, which finally led above the previously reached all-time high at 42’000 USD and marked a new all-time high just below 60’000 USD on February 21. Since then, a renewed correction has been underway, bottoming out just above the last high. Since the beginning of the reporting week, the price has been trending upwards again.
Outlook
Bitcoin has been in an accentuated uptrend since breaking the 2017 all-time high. This has been accompanied by 2 healthy consolidations so far, which each found their bottom above the 50-day moving average (light blue line). Since then, the price moves around a trendline, which acts as support and resistance respectively. A resulting regression trend over 2 standard deviations has since served as a fairly accurate indicator of the trend channel.
The structure of the uptrend is absolutely intact due to the support zones above 40’000 USD defended during the reporting week and the chances of a continuation of the recent bullish microtrend are good. Resistances exist in the area of 52’500 USD. If these can be climbed sustainably, the signs are favourable for a renewed test of the 60’000 USD zone. A breakout through this area makes a continuation of the parabola likely.
The intact bullish momentum would be damaged with the break of the channel and the 50-day moving average in the area 42’000-41’000 USD. In this case, the area around 35’000 USD serves as the first support.
Macro: New all-time highs
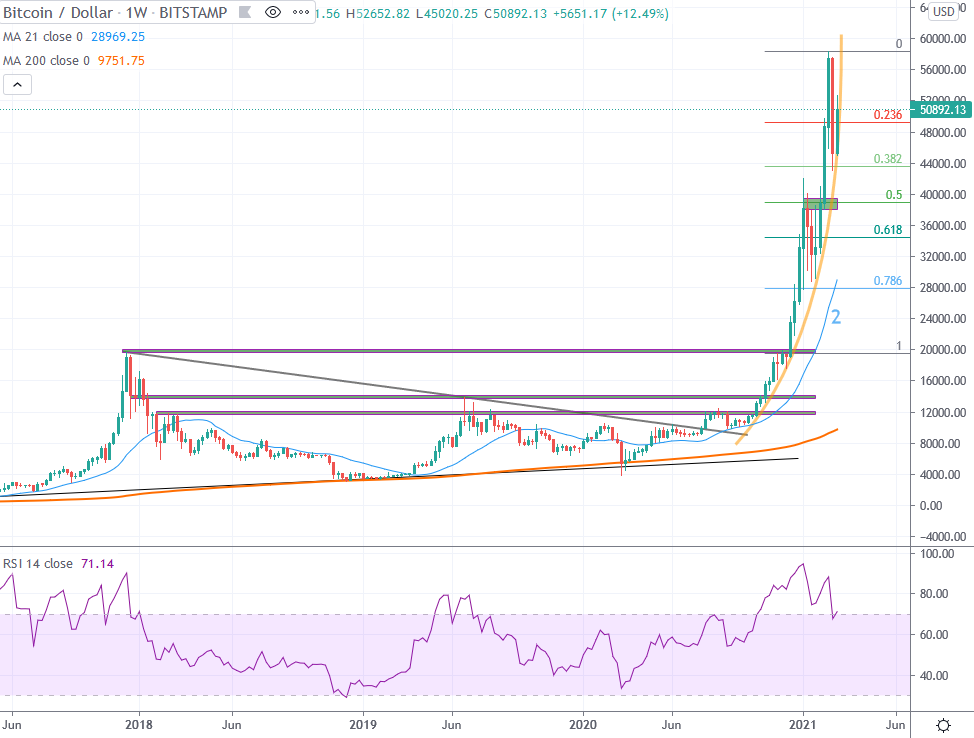
Bitcoin was able to set a higher high above 10’000 USD for the first time in the weekly interval in 2020, which broke the prevailing bearish trend since December 2017. This broke the series of lower highs that lasted for 135 weeks (1).
Since the breakout of the bearish trend, the signs for a valid trend reversal intensified. With the push through important resistance zones and a continuous development above the 21-week moving average (2), the probabilities for a renewed reaching of the all-time high created in 2017/18 increased. This was accomplished in mid-December 2020. Since then, a strongly accentuated price discovery above this mark has been taking place.
With the price movements in the past year, a good foundation was created to sustainably climb new spheres beyond the all-time highs reached in 2017. The break of 20’000 USD impressively demonstrated the power of the upward movement that had been established since October. It resulted in a parabola, which reached its first high at just over 42’000 USD. After a one-month correction, this was continued and found its preliminary high above the 58’000 USD mark.
In case of an incipient correction, a respect of the previously created supports (green) over the next weeks/months will be necessary to sustain the initiated phase of exploration in new price spheres. What remains to be observed here is the first zone of the one-month march stop around 39’000 USD. In case of a continued correction, the 21-week average (2) becomes relevant, which so far could reliably indicate bull and bear phases. This is currently just below 26’000 USD and rises accordingly quickly. Further support zones in the weekly interval can be found in the area of 20’000 USD.
*Originally posted at CVJ.CH
Disclaimer
All information in this publication is provided for general information purposes only. The information provided in this publication does not constitute investment advice and is not intended as such. This publication does not constitute and is not intended as an offer, recommendation or solicitation to invest in any financial instrument, including cryptocurrencies and the like. The contents contained in the publication represent the personal opinions of the respective authors and are not suitable or intended as a basis for decision-making.
Risk notice
Investing in cryptocurrencies, is fundamentally associated with risk. The total loss of the invested capital cannot be excluded. Cryptocurrencies are very volatile and can therefore be exposed to extreme price fluctuations in a short period of time.
