
Bitcoin USD Chart Analysis – Cracking the all-time high of 2017
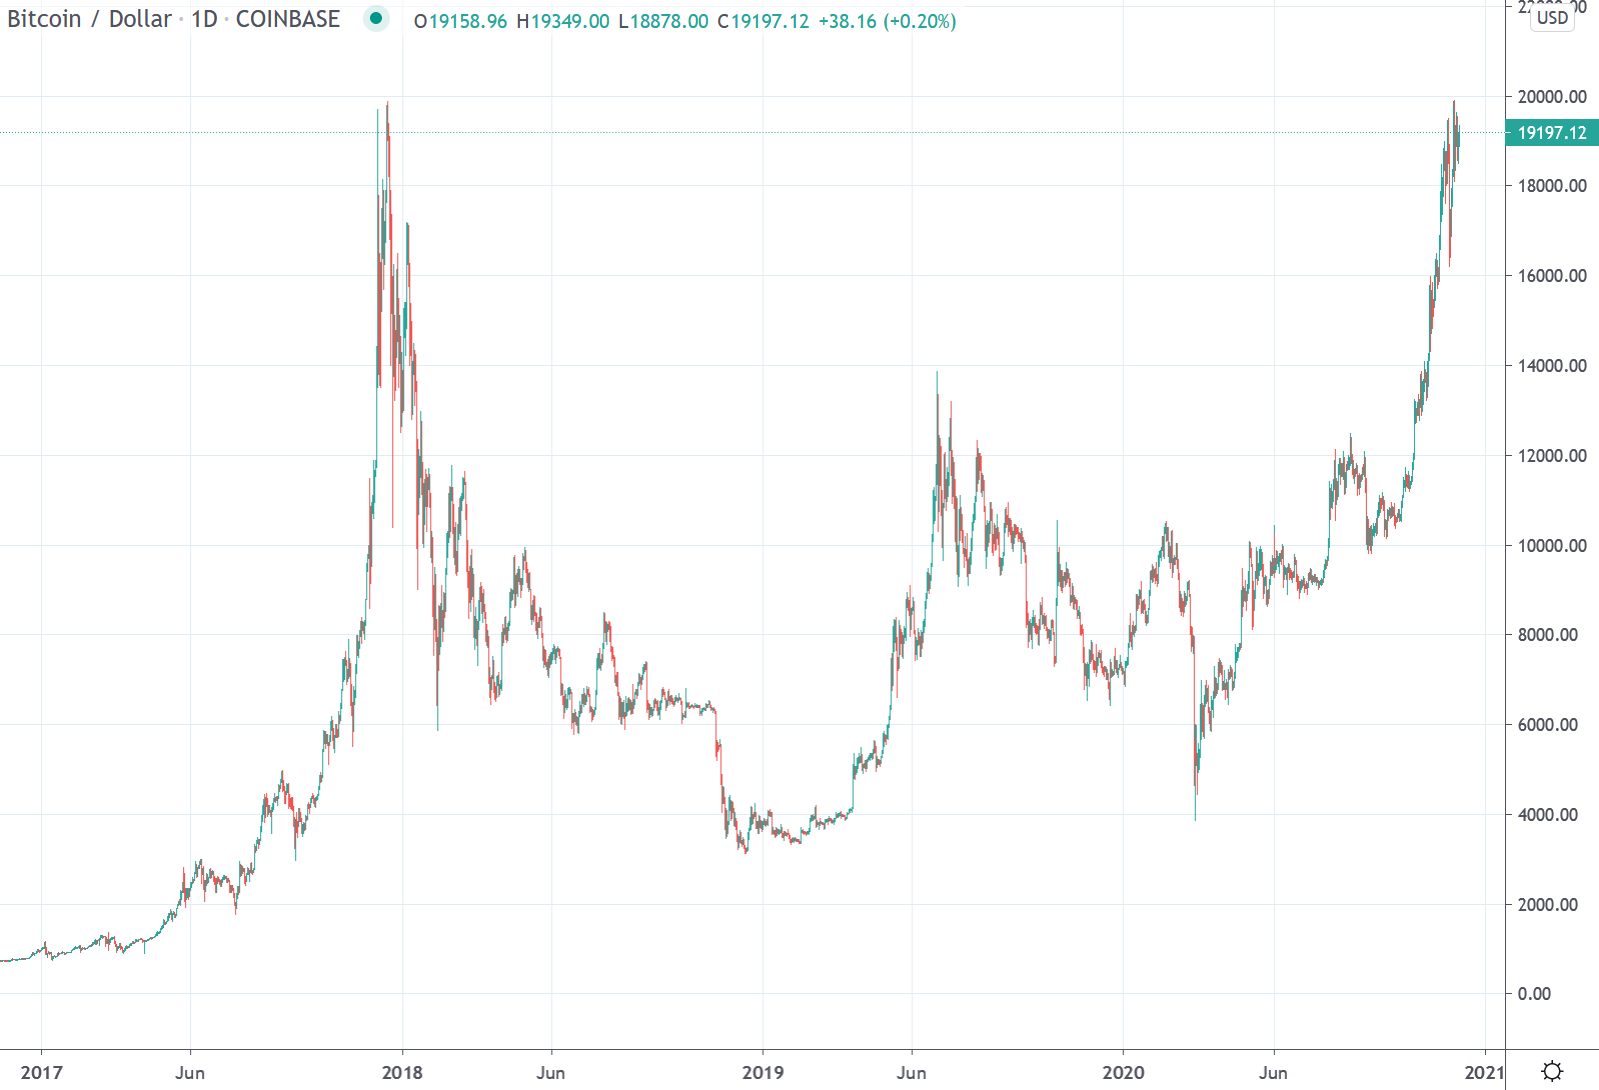
While the previous week was still characterized by a temporary correction, the reporting week was already showing the pattern of rising prices that has been observed more as in recent times. On Sunday, trading activity above the USD 18’000 mark was observed. This was after a correction from USD 19,500 to below USD 16,500 in the previous week. Three days after reaching the low of the previous week, the USD 18’000 level was already recaptured. The bullish market momentum was confirmed by the finding that no serious selling pressure could be perceived even at higher levels. With the momentum intact, the level of the all-time high of 2017, around USD 19,700, was briefly exceeded on Monday. On Tuesday, a slightly higher daily high than on the previous day was followed by a rejection, which brought the price close to the USD 18,000 zone at the daily low. However, the daily closing price pushed to USD 18,800. Trading on Wednesday and Thursday was concluded with higher daily closing prices. The last three days of the week were traded around the USD 19,000 zone, with trading margins decreasing towards the end of the week.
Breakthrough through 14’000 USD leads to parabolic rise
Review Daily Interval
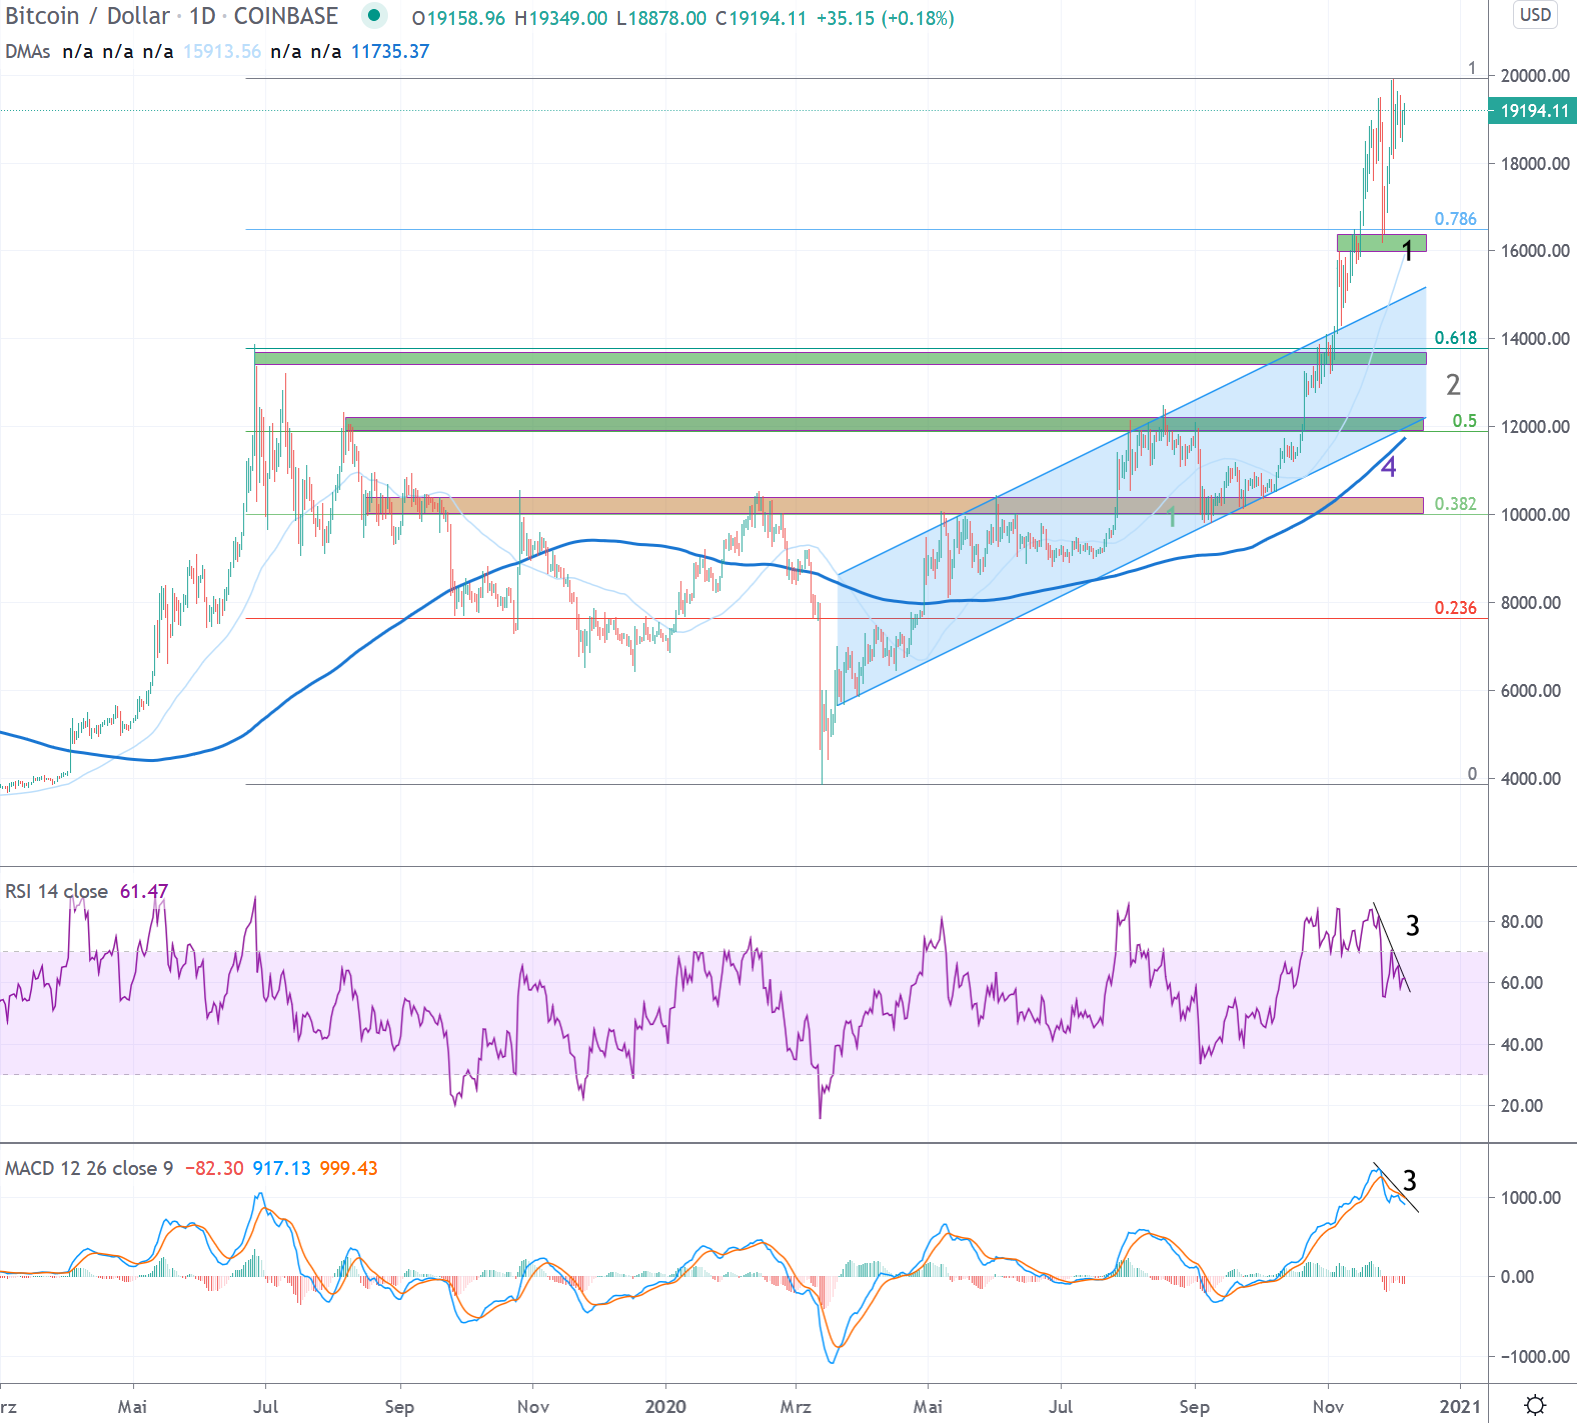
A veritable countermovement established itself after the price slump in mid-March. This led up to the resistance zones starting at USD 10,000. After a renewed rejection at the beginning of June, an almost two-month consolidation was observed. This was characterized by a series of higher daily lows and lower daily highs. The series of lower highs was broken on 22 July. This was followed on July 27 by a break through the resistance zone around USD 10,500, which has been established since August 2019 and which Bitcoin has already failed to break several times.
The resistance zone around USD 10,000 was interesting in several respects. On the one hand, it contained the 0.618 Fibonacci point of the entire downtrend, which was heralded at the end of June 2019 just below USD 14,000. On the other hand, the zone around USD 10,000 simultaneously served as a confirmation of the still bearish trend of lower highs since December 2017 (see next section). This zone now counts as significant support (green).
Bitcoin has been able to establish itself above the newly created support in the USD 10,000 zone since the end of July. This support was confirmed by a re-test in early September and has since then served as the beginning and important pillar of the recent positive trend. Since then, further significant resistance zones have been overcome. On October 21, for example, the resistance zone around USD 12,200 was breached, which became established as early as January 2018 and has served as the zenith for the Bitcoin price on several occasions since then (see macro outlook). In the following weeks, the positive trend intensified and led Bitcoin to the “last visible resistance” at USD 14,000, before the all-time high.
At USD 14,000, an important resistance was overcome, which stood against a “clear sky” scenario up to the all-time high. An impressive act of strength and a first-class proof that the market is serious about the trend reversal that has been initiated this year. The breakthrough was reinforced by the simultaneous break of the upper trend line of the trend channel that has been forming since March (light blue). This led to a strong accentuation of the uptrend from the beginning of November, which most recently brought the Bitcoin price in a parabolic rise to the all-time high of December 2017.
Outlook
The parabolic rise, which catapulted the Bitcoin price from USD 12,000 to over USD 19,500 within 34 days, came to a temporary halt just above the all-time high reached in 2017. The consequence was a two-week consolidation in the zone between USD 16,180 and USD 19,870. The former serves as a support zone after USD 18,400 (0.786 Fibonacci point 1), with the latter representing resistance in front of unrivalled territories. With the recent consolidation, the MACD and RSI indicators have been able to break away from the overbought areas and form negative divergences with respect to the price trend, which is a sign of a loss of momentum (3). Nevertheless, crossing the psychologically significant USD 20,000 zone should trigger more price fireworks.
Last week’s price movements have laid a foundation that creates a good basis for climbing higher spheres than the 2017 highs in the medium term. In order for this undertaking to succeed, the recently overcome resistances should be respected as support in the coming weeks (green). The zone between USD 12’000 and 14’000 remains an important pillar. In addition to old resistances that now serve as support, the interesting 0.618 and 0.5 Fibonacci points of this year’s trading range are also located in this area (2). Basic support has also formed at around USD 12,000. Serving as resistance since August 2019, the lower trendline of the channel that has been established since March 2020 (blue) is now also located within this support area. Similarly, the 200-day moving average (4) moves accentuated into this zone.
Macro: At the all-time high
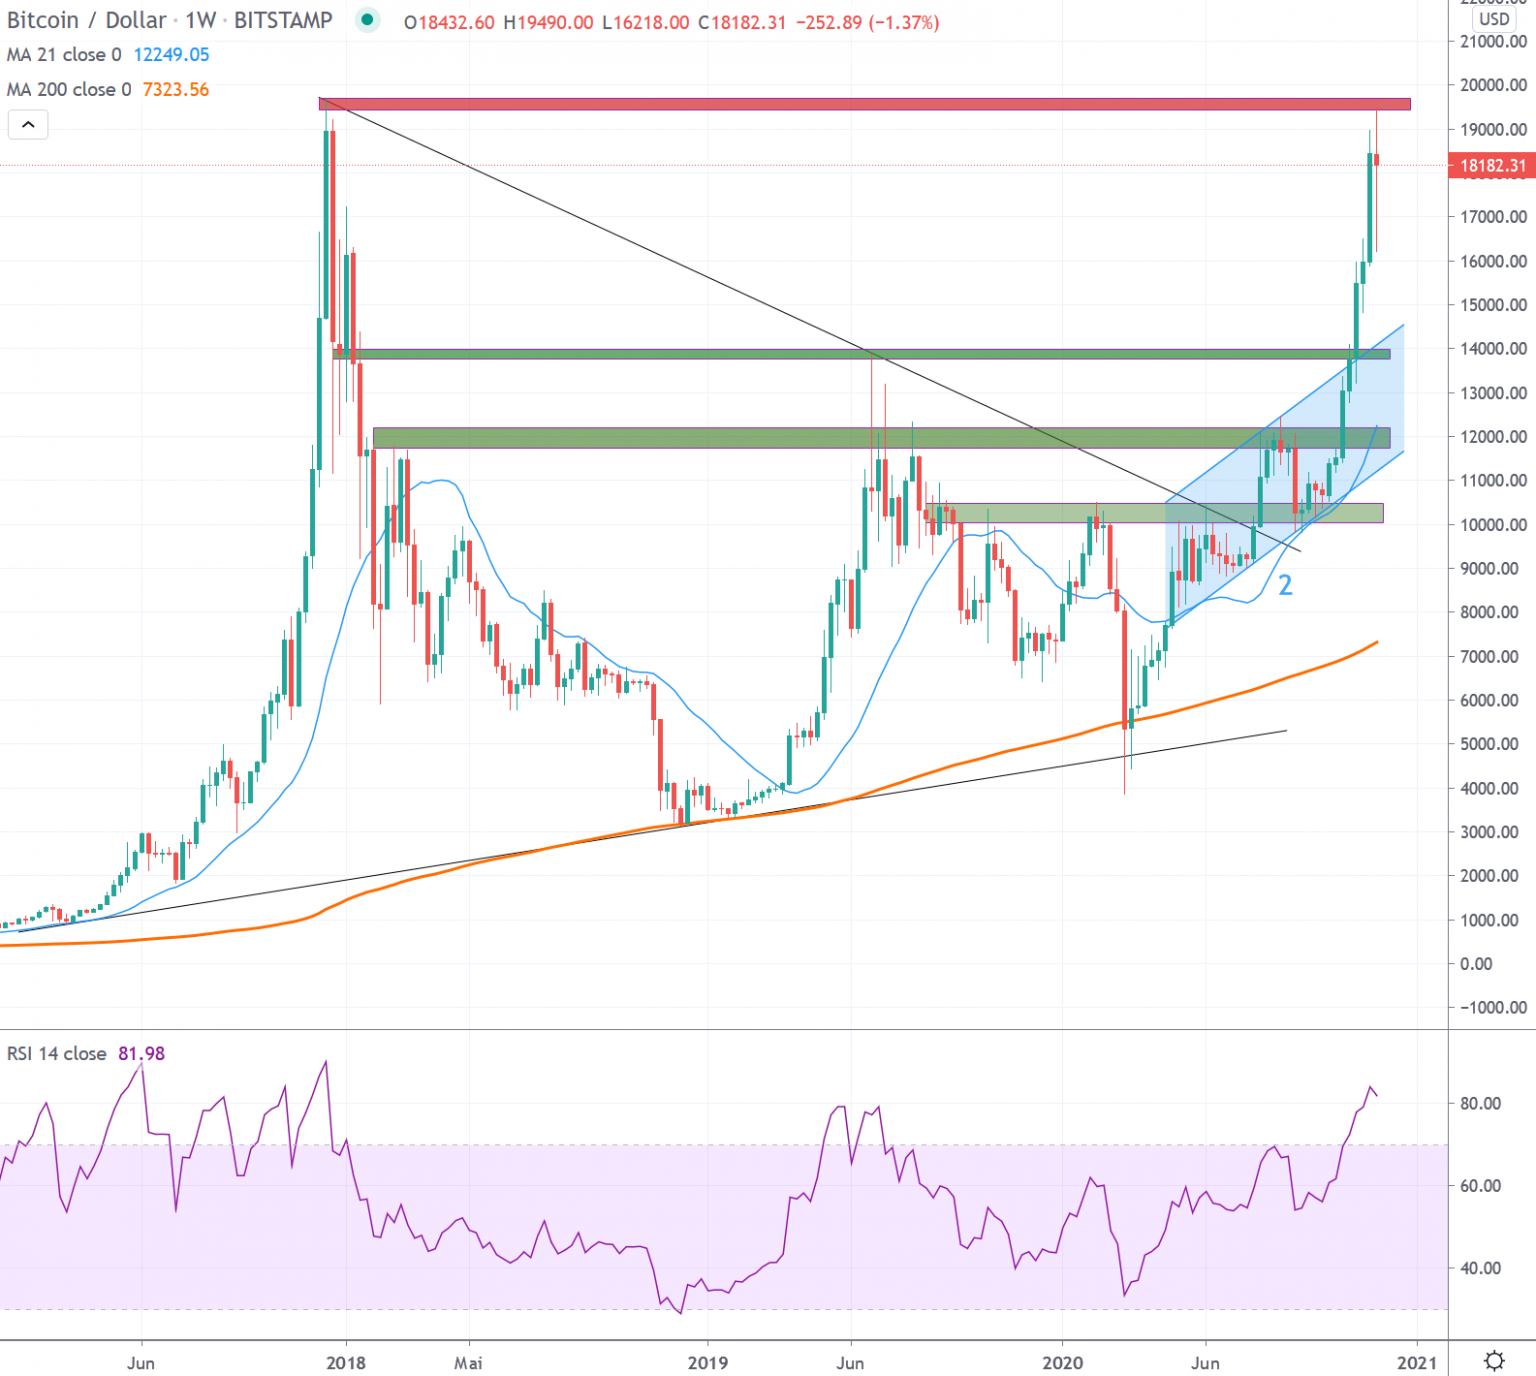
In 2020, Bitcoin was able to set a higher weekly high above USD 10,000 for the first time, breaking the prevailing bearish trend since December 2017. This broke the series of lower highs that had lasted for 135 weeks.
Since the breakthrough of the bearish trend, the signs of a valid trend reversal have become stronger. With the breach through important resistance zones and a continuous trend above the 21 week average (2), the probability of reaching the all-time high created in 2017/18 increased. This was achieved in the reporting week.
Last week’s price movements created a good foundation for reaching new spheres beyond the USD 20,000 level. Corrections become more likely after accentuated price increases. Thereby, a sustainable respect for the newly created supports (green) over the next weeks/months is necessary in order to reach new highs in the coming months.
*Originally posted at CVJ.CH
