
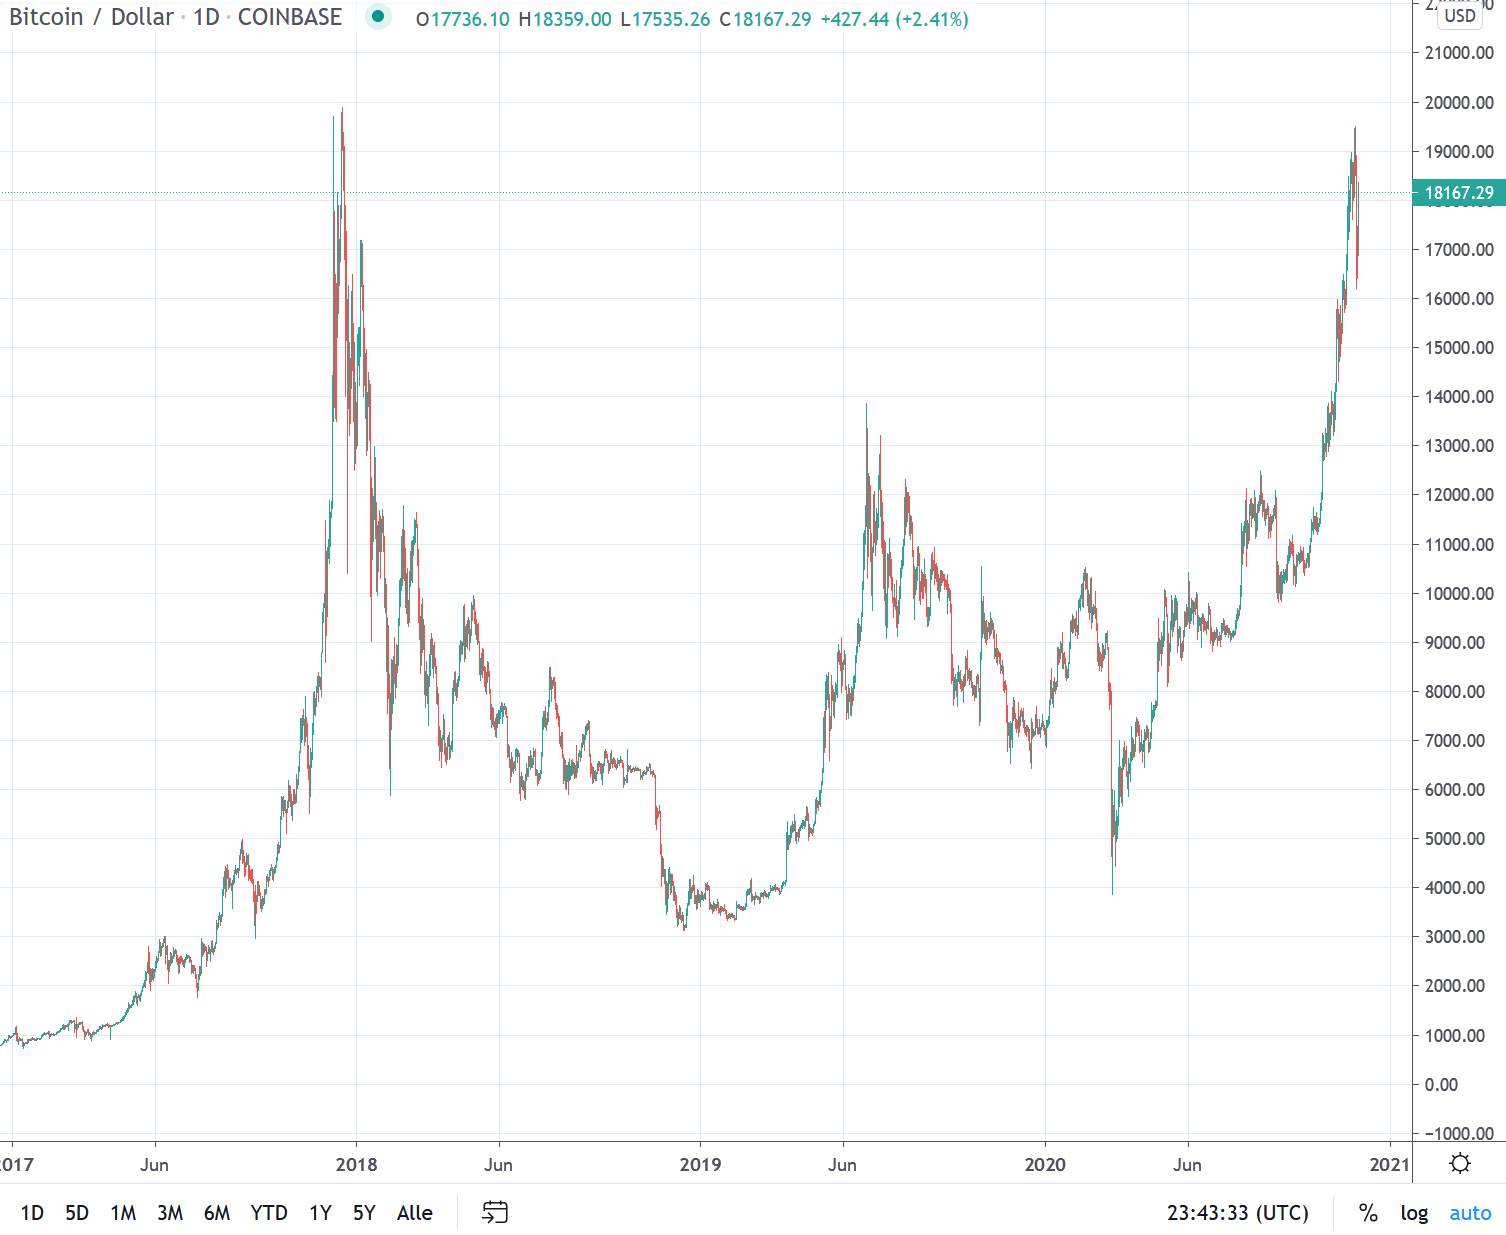
Bitcoin USD chart analysis – First correction after reaching new highs
Monday began with a relatively quiet trading day, with trading around the USD 18,350 mark. On Sunday, a first test of the market’s strength reached a daily low of 17’600. The following day saw the usual pattern of higher daily lows. This momentum was used on Tuesday, and Bitcoin was able to break through the USD 19,000 mark for the first time this year, setting a new annual high. On Wednesday, another higher daily low of 18,532 was recorded, but the daily closing price was below USD 19,000. This was followed on Thursday by the first major correction since the rise on October 21, which started at around USD 12,000. A sell-off led the Bitcoin price at the daily low to the first supports above USD 16,000. The close of the day was marked at USD 17,170. Friday was a classic turning point with a trading range of a good USD 1,000 and a daily closing price close to that of the previous day. This was followed by two green candles with higher daily lows and highs, which took the Bitcoin price back above the USD 18,000 mark at the end of the week.
Breakthrough through 14’000 USD leads to parabolic rise
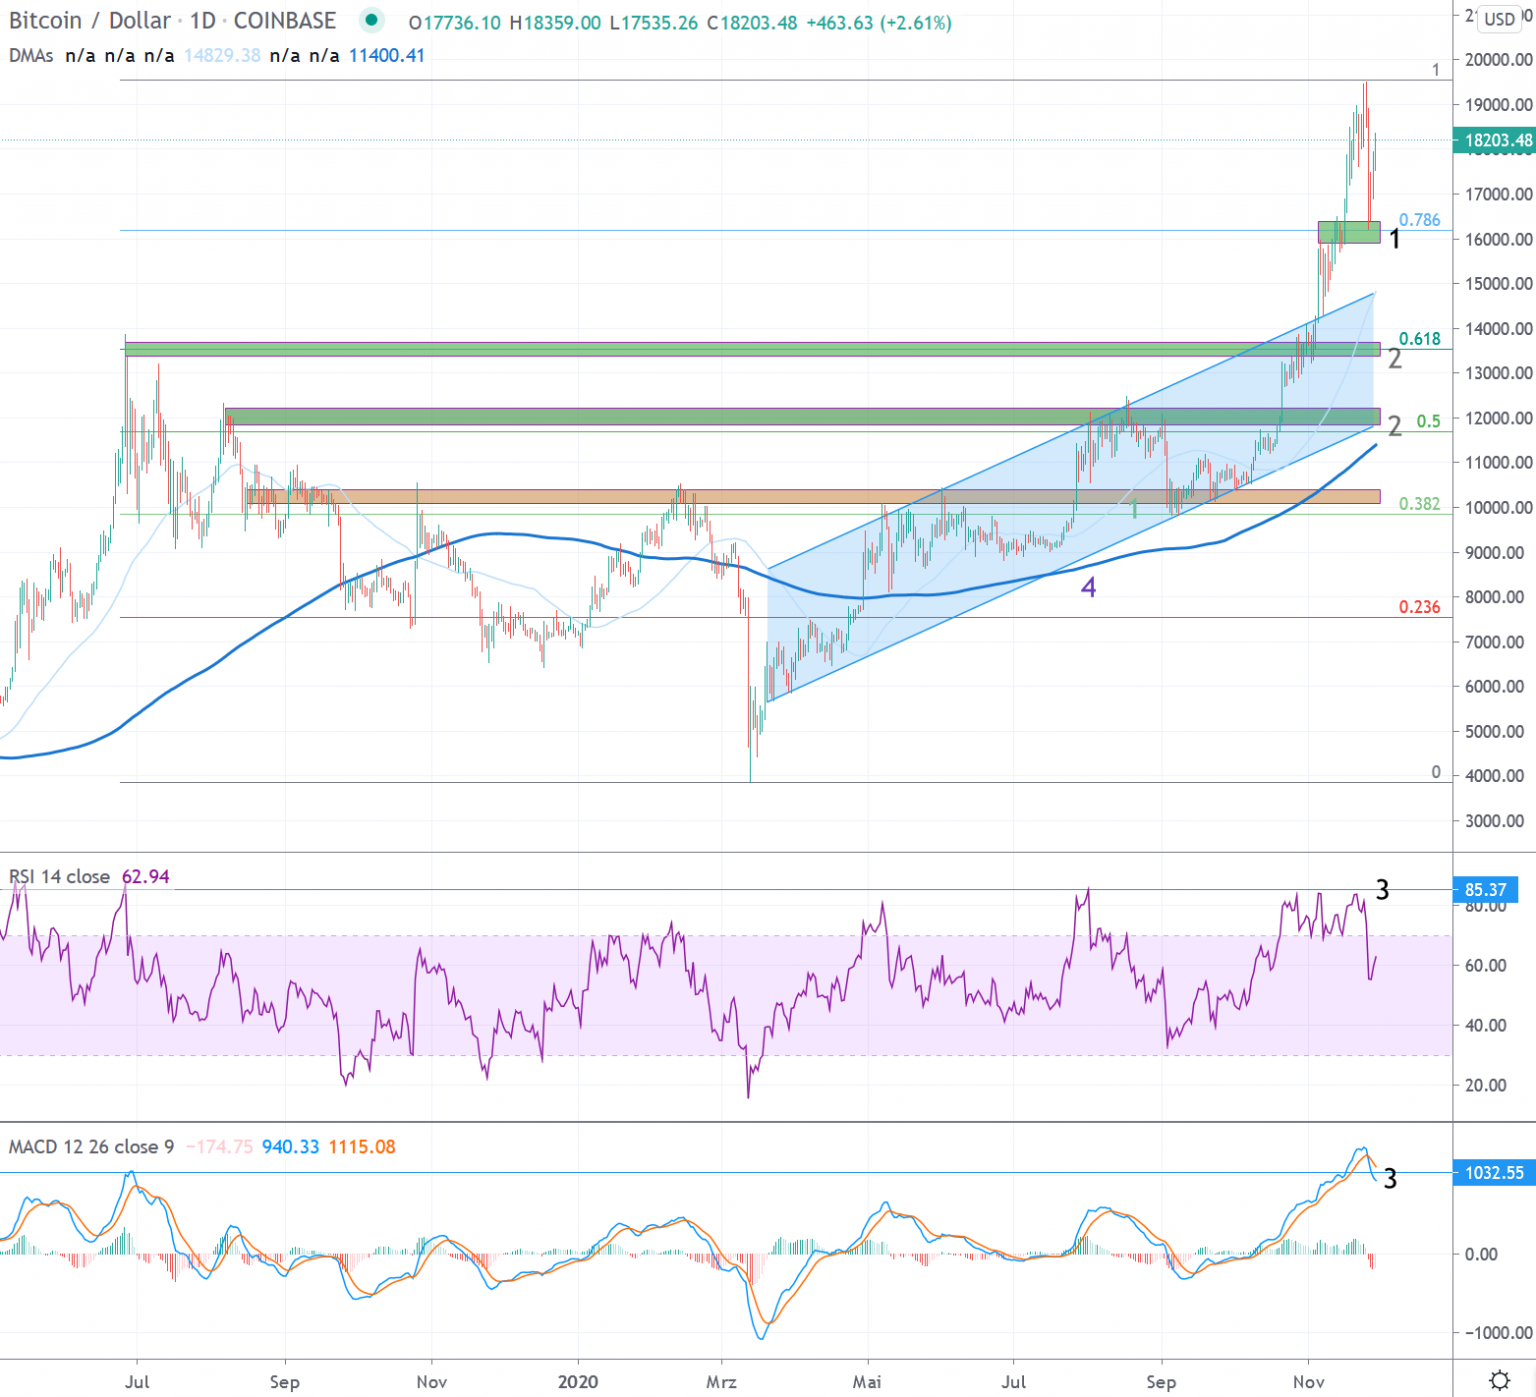
Review Daily Interval
A veritable countermovement established itself after the price slump in mid-March. This led up to the resistance zones starting at USD 10,000. After a renewed rejection at the beginning of June, an almost two-month consolidation was observed. This was characterized by a series of higher daily lows and lower daily highs. The series of lower highs was broken on 22 July. This was followed on July 27 by a break through the resistance zone around USD 10,500, which has been established since August 2019 and which Bitcoin has already failed to break several times.
The resistance zone around USD 10,000 was interesting in several respects. On the one hand, it contained the 0.618 Fibonacci point of the entire downtrend, which was heralded at the end of June 2019 just below USD 14,000. On the other hand, the zone around USD 10,000 simultaneously served as a confirmation of the still bearish trend of lower highs since December 2017 (see next section). This zone now counts as a significant support (green).
Bitcoin has been able to establish itself above the newly created support in the USD 10,000 zone since the end of July. This support was confirmed by a re-test in early September and has since then served as the beginning and important pillar of the recent positive trend. Since then, further significant resistance zones have been overcome. On October 21, for example, the resistance zone around USD 12,200 was breached, which became established as early as January 2018 and has served as the zenith for the Bitcoin price on several occasions since then (see macro outlook). In the following weeks, the positive trend intensified and led Bitcoin to the “last visible resistance” at USD 14,000, before the all-time high.
At USD 14,000, an important resistance was overcome, which stood against a “clear sky” scenario up to the all-time high. An impressive act of strength and a first-class proof that the market is serious about the trend reversal that has been initiated this year. The breakthrough was reinforced by the simultaneous break of the upper trend line of the trend channel that has been forming since March (light blue). This led to a strong accentuation of the uptrend from the beginning of November, which most recently brought the Bitcoin price in a parabolic rise to the all-time high of December 2018
Outlook
The parabolic rise, which catapulted the Bitcoin price from USD 12,000 to almost USD 19,500 within 34 days, came to a temporary end in the reporting week. The recent sharp rally also led the MACD and RSI indicators into overbought territory (3). In the reporting week, just below the all-time high, a first strong rejection occurred, which led Bitcoin directly back to the support zone above USD 16,000 (1). This is also where the 0.786 Fibonacci point of this year’s price action is located. In the short term, the new resistance at 19’500 and the support at 16’000 USD serve as first indicators if the parabolic rise has reached its peak.
With the price movements last week, a foundation was created that is necessary to reach or even exceed the highs of 2017 again. However, in order to achieve higher price targets, a sustained movement is necessary. In order for this to succeed, the recently overcome resistances should be respected as support in the coming weeks (green). The zone between USD 12,000 and 14,000 remains an important pillar. In addition to old resistances that now serve as support, the interesting 0.618 and 0.5 Fibonacci points are also located in this area (2). A basic support has also formed at around USD 12,000. Serving as resistance since August 2019, the lower trendline of the channel that has been established since March 2020 (blue) is now also located within this support area. Similarly, the 200-day moving average (4) moves accentuated into this zone.
Macro: All-time high in sight
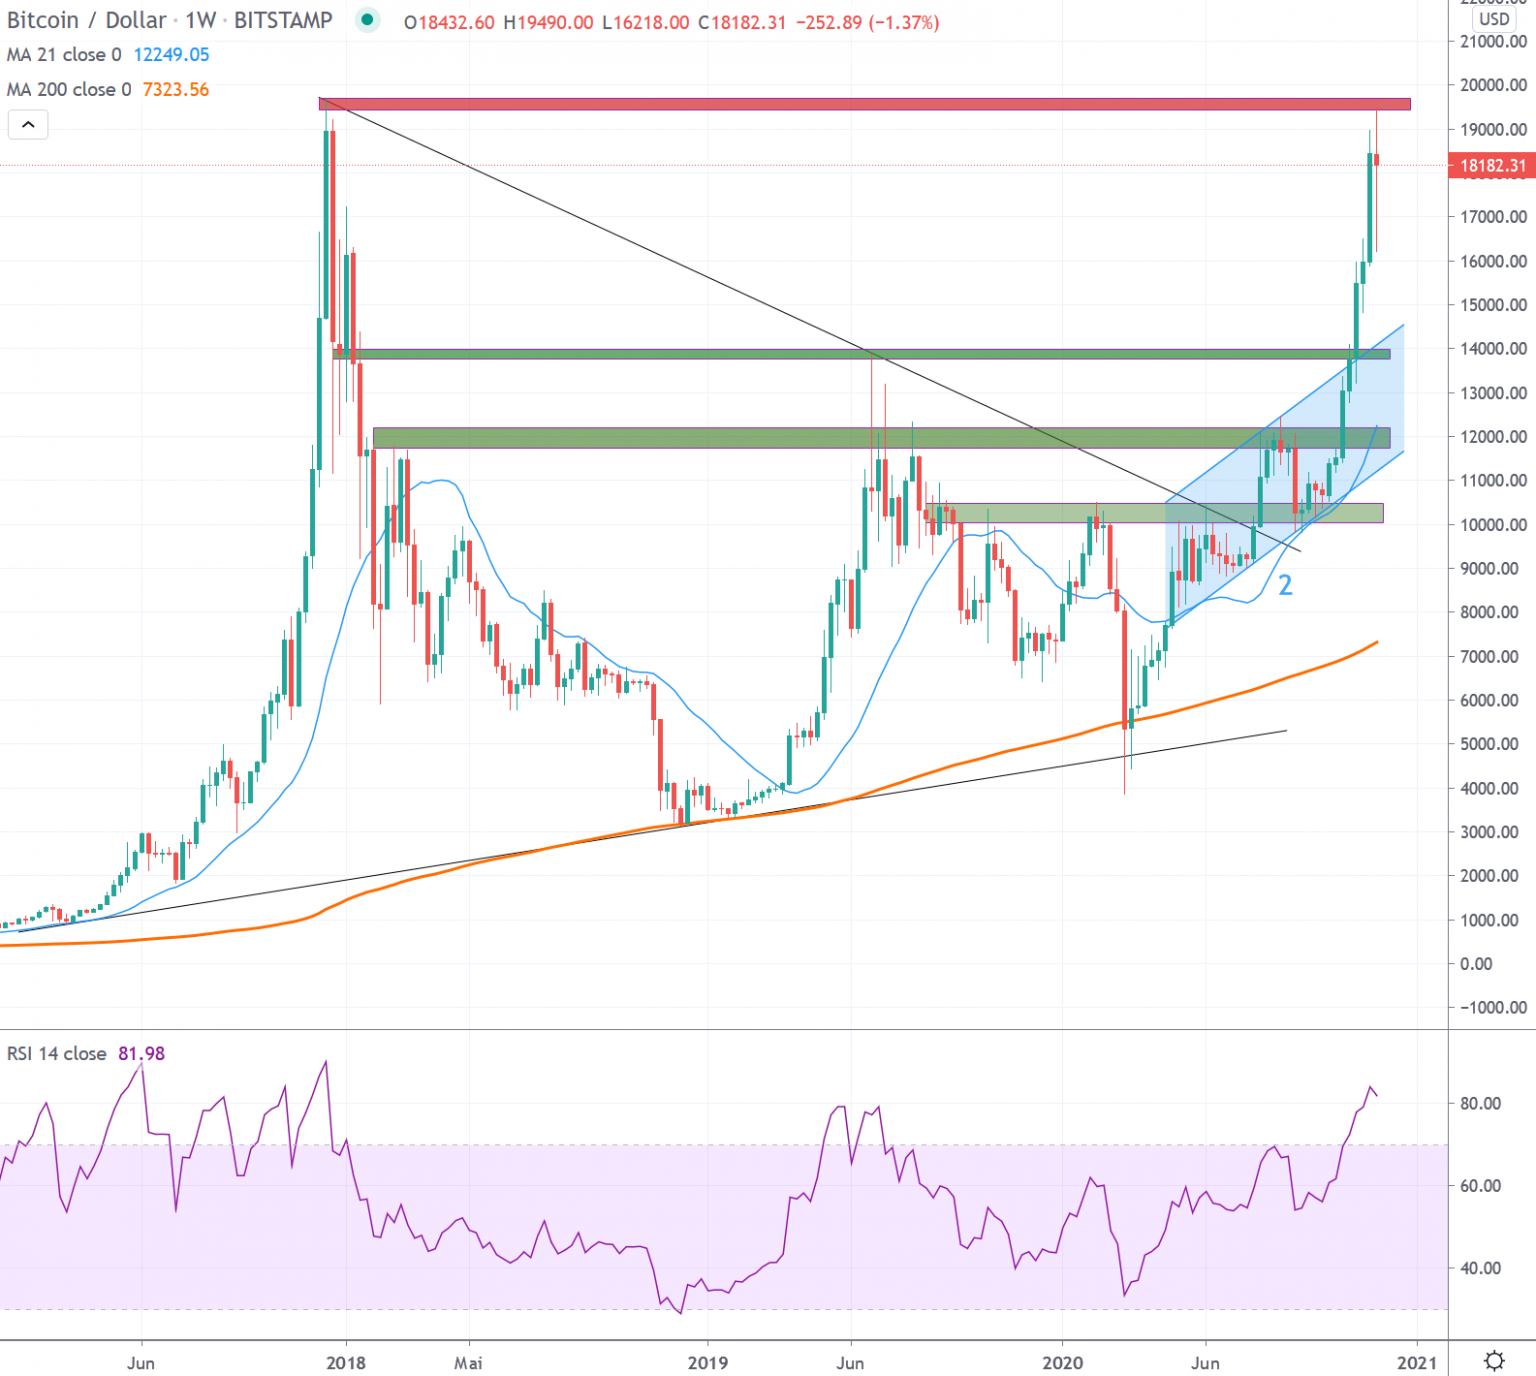
In 2020, Bitcoin was able to set a higher weekly high above USD 10’000 for the first time, breaking the prevailing bearish trend since December 2017. This broke the series of lower highs that had lasted for 135 weeks.
Since the breakthrough of the bearish trend, the signs of a valid trend reversal have become stronger. With the breach through important resistance zones and a continuous trend above the 21 week average (2), the probability of reaching the all-time high created in 2017/18 increased.
Last week’s price movements created a good foundation. In order to reach new spheres above the all-time high, sustainable respect of the newly created supports (green) over the next weeks/months is necessary.
*Originally posted at CVJ.CH
