
Bitcoin USD daily basis
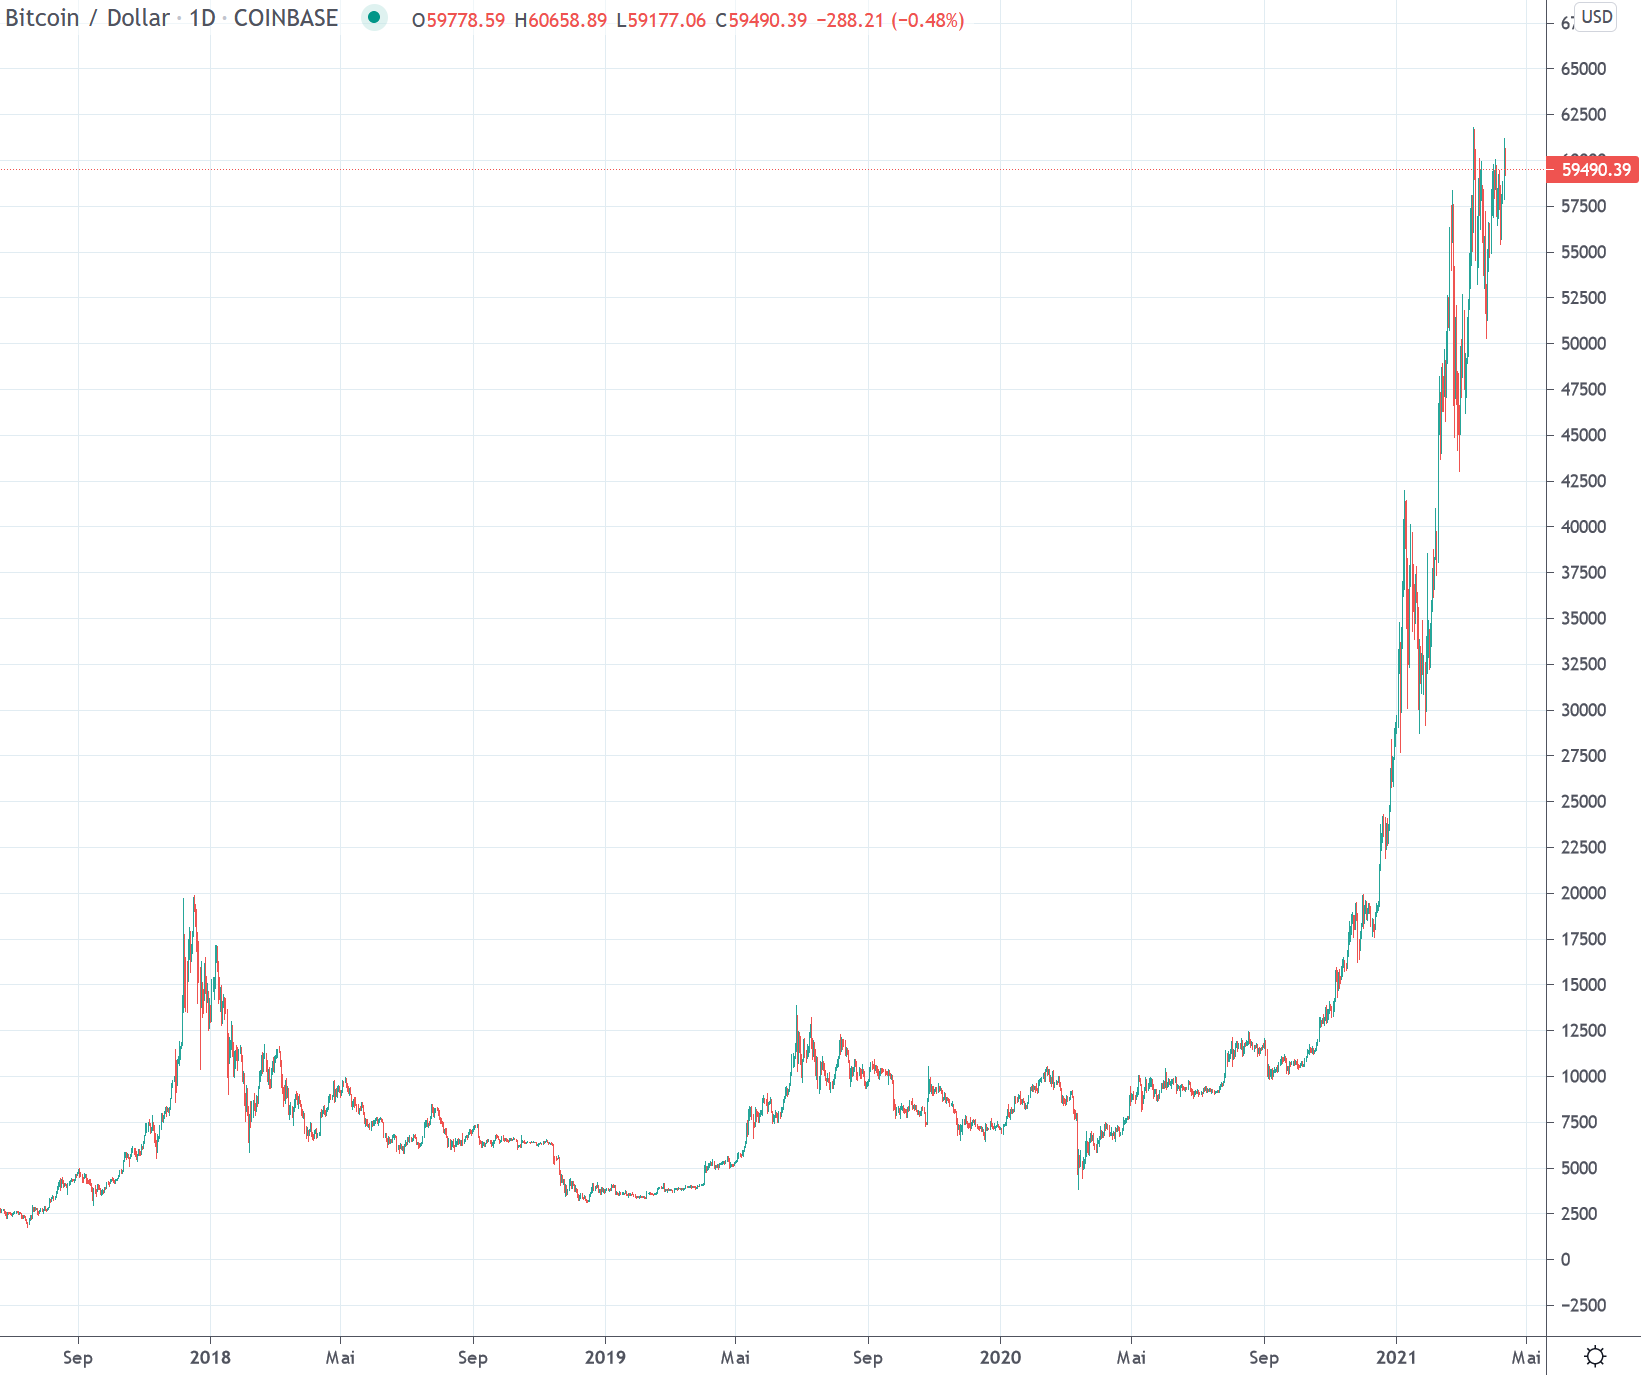
Bitcoin USD Chart Analysis – Consolidation below 60’000 USD
The reporting week was quiet in terms of Bitcoin volatility ratios. Throughout the week, the main trading activity was concentrated in the 58′,000 USD – 59’000 USD range. Mid-week, the price set off for a test of the current market strength on Wednesday with a small setback back to the 56’000 USD level. On Thursday, the market provided a clear answer that the time for major corrections has not yet come with a snap back to the level of 58’000 USD. Accordingly, the price trend at the end of the week led back to the zone 60’000 USD – an area that has served as resistance since mid-March.
Intact structure of the uptrend
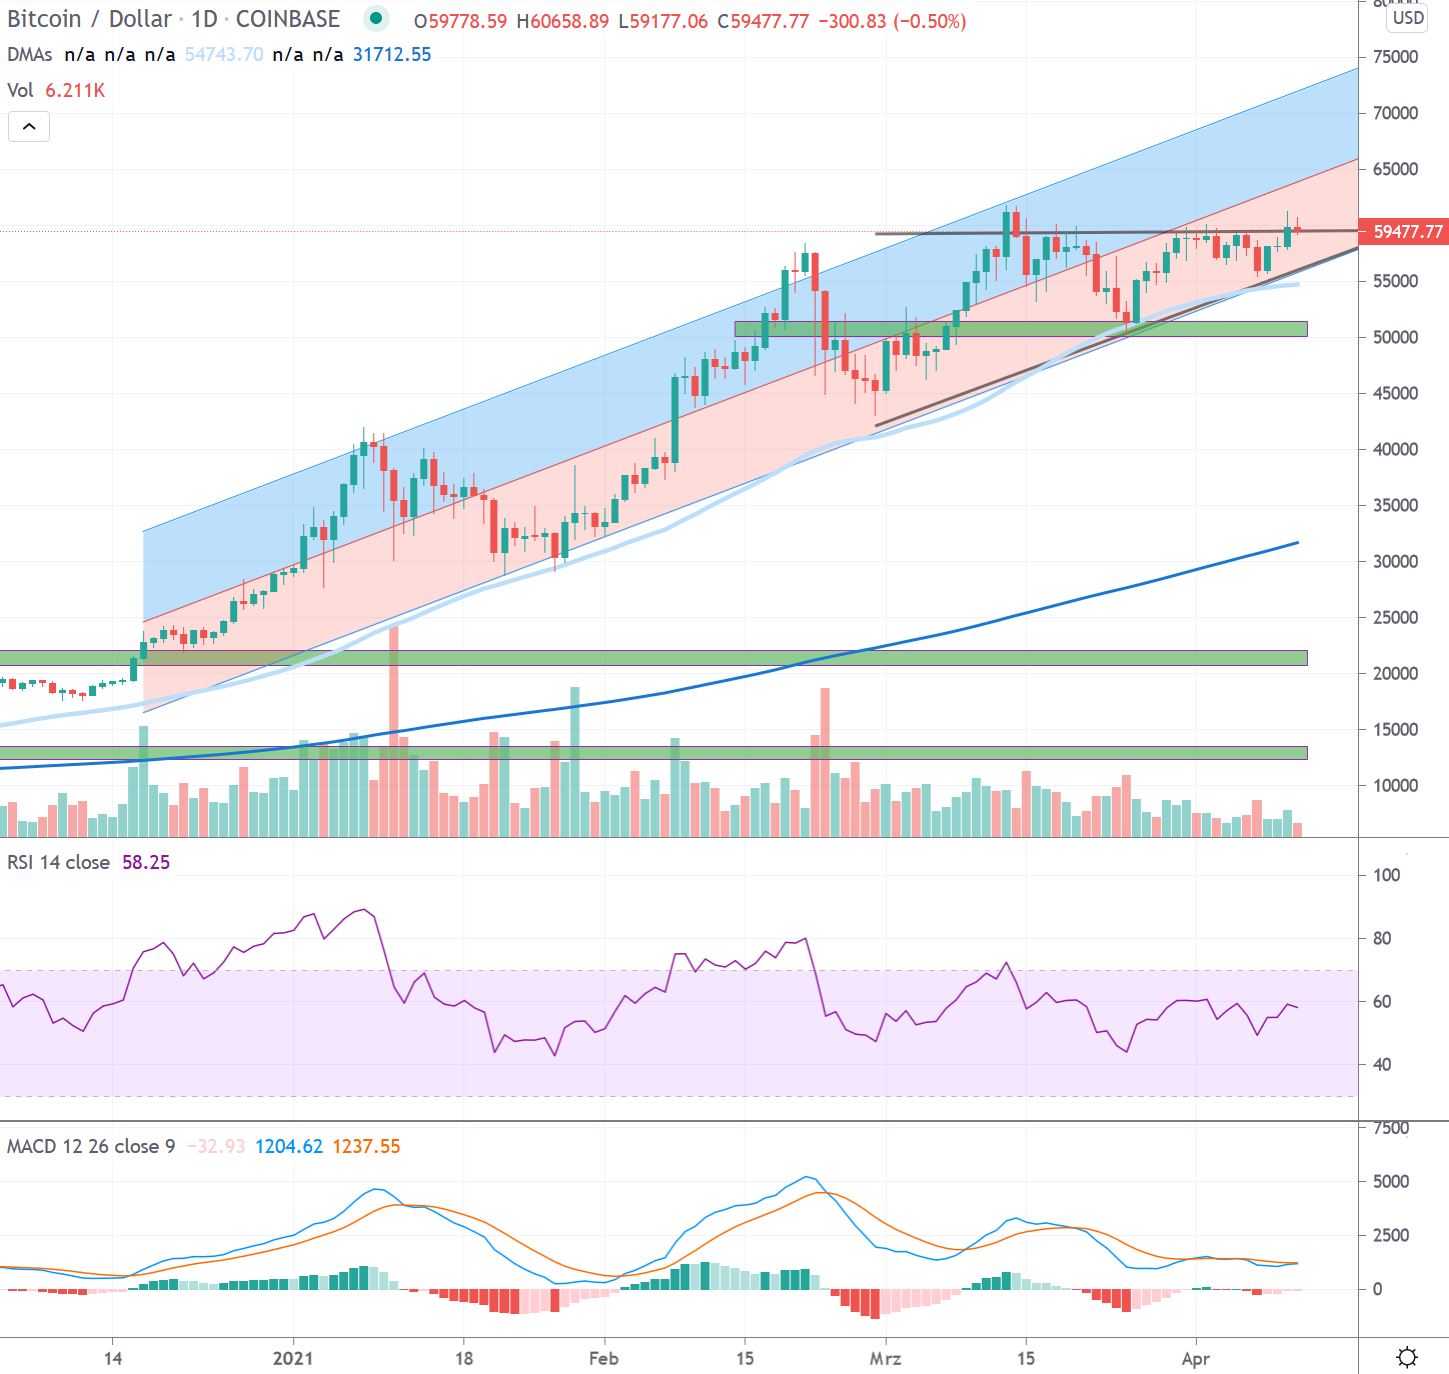
Review Daily Interval
After the price plunge in mid-March 2020, a veritable countermovement established itself. This led to the resistance zones from 10’000 USD. After an initial rejection and a consolidation phase lasting almost two months, a breakout through the fundamental resistance zone followed on July 27, which had been established since August 2019 and had already caused Bitcoin to fail a few times to date.
The resistance zone around 10’000 USD was interesting in several respects. On the one hand, the 0.618 Fibonacci point of the entire downward movement, which was initiated at the end of June 2019 just below 14’000 USD, is located here. On the other hand, the zone around 10,000 USD simultaneously acted as a confirmation of the still bearish trend from lower highs since December 2017 (see macro view on a weekly basis). Bitcoin was able to establish itself above the newly created support in the 10,000 USD area since the end of July 2020 and provided a first confirmation of a trend reversal with the break of the resistance zone around 12’200 USD towards the end of October 2020. In the following weeks, the positive trend accentuated and led Bitcoin through the 14’000 USD resistance in early November 2020 and close to the then all-time highs around 20’000 USD for the first time in early December, which remained untouched for 158 weeks since the bull market in 2017.
Since the breakout through the important 14’000 USD resistance at the beginning of November, it has been blow by blow. The break through the old all-time high at 20’000 USD saw a strong accentuation of the uptrend. Subsequently, the price doubled in only 23 days. A first correction brought the price back below 30’000 USD. Thereafter, a renewed upward movement began, which finally led above the previously reached all-time high at 42’000 USD and marked a new all-time high just below 60’000 USD on February 21. After an incipient correction, a new all-time high was recorded just below the 62’000 USD mark. Since then, the price has been consolidating below the new all-time high.
Outlook
Bitcoin has been in an accentuated uptrend since the break of the 2017 all-time high. This has been accompanied by three healthy consolidations so far, all of which found their bottom above the 50-day moving average (light blue line). Since the break of the 2017 all-time high, the price has been moving around a trendline, which acts as support and resistance, respectively. A resulting regression trend over two standard deviations has since served as an accurate indicator of the trend channel.
The structure of the uptrend is absolutely intact with the respective lows of the previous corrections. The market continues to develop around the mentioned trend line since mid-December. Since testing the lower area of the regression channel on March 25, a steady upward movement leads back to the 60’000 USD resistance zone. In the process, a rising wedge is forming. The current bull market would receive a strong validation with a break through this zone and consequently the all-time high at 61’800 USD. A breakout should therefore quickly lead to the trend line at 64’500 USD and possibly even to the upper area of the channel to 72’000 USD.
If the recent upward movement weakens, the lower trend line of the regression channel in the area of 56’000 USD acts as support. Just below it is the 50-day moving average (light blue line), which so far serves as a good indicator of the bullish phase that started in November.
The intact bullish momentum would be sustainably damaged with the break of the channel and the 50 day average as well as the 50’000 support zone.
Macro: New all-time highs
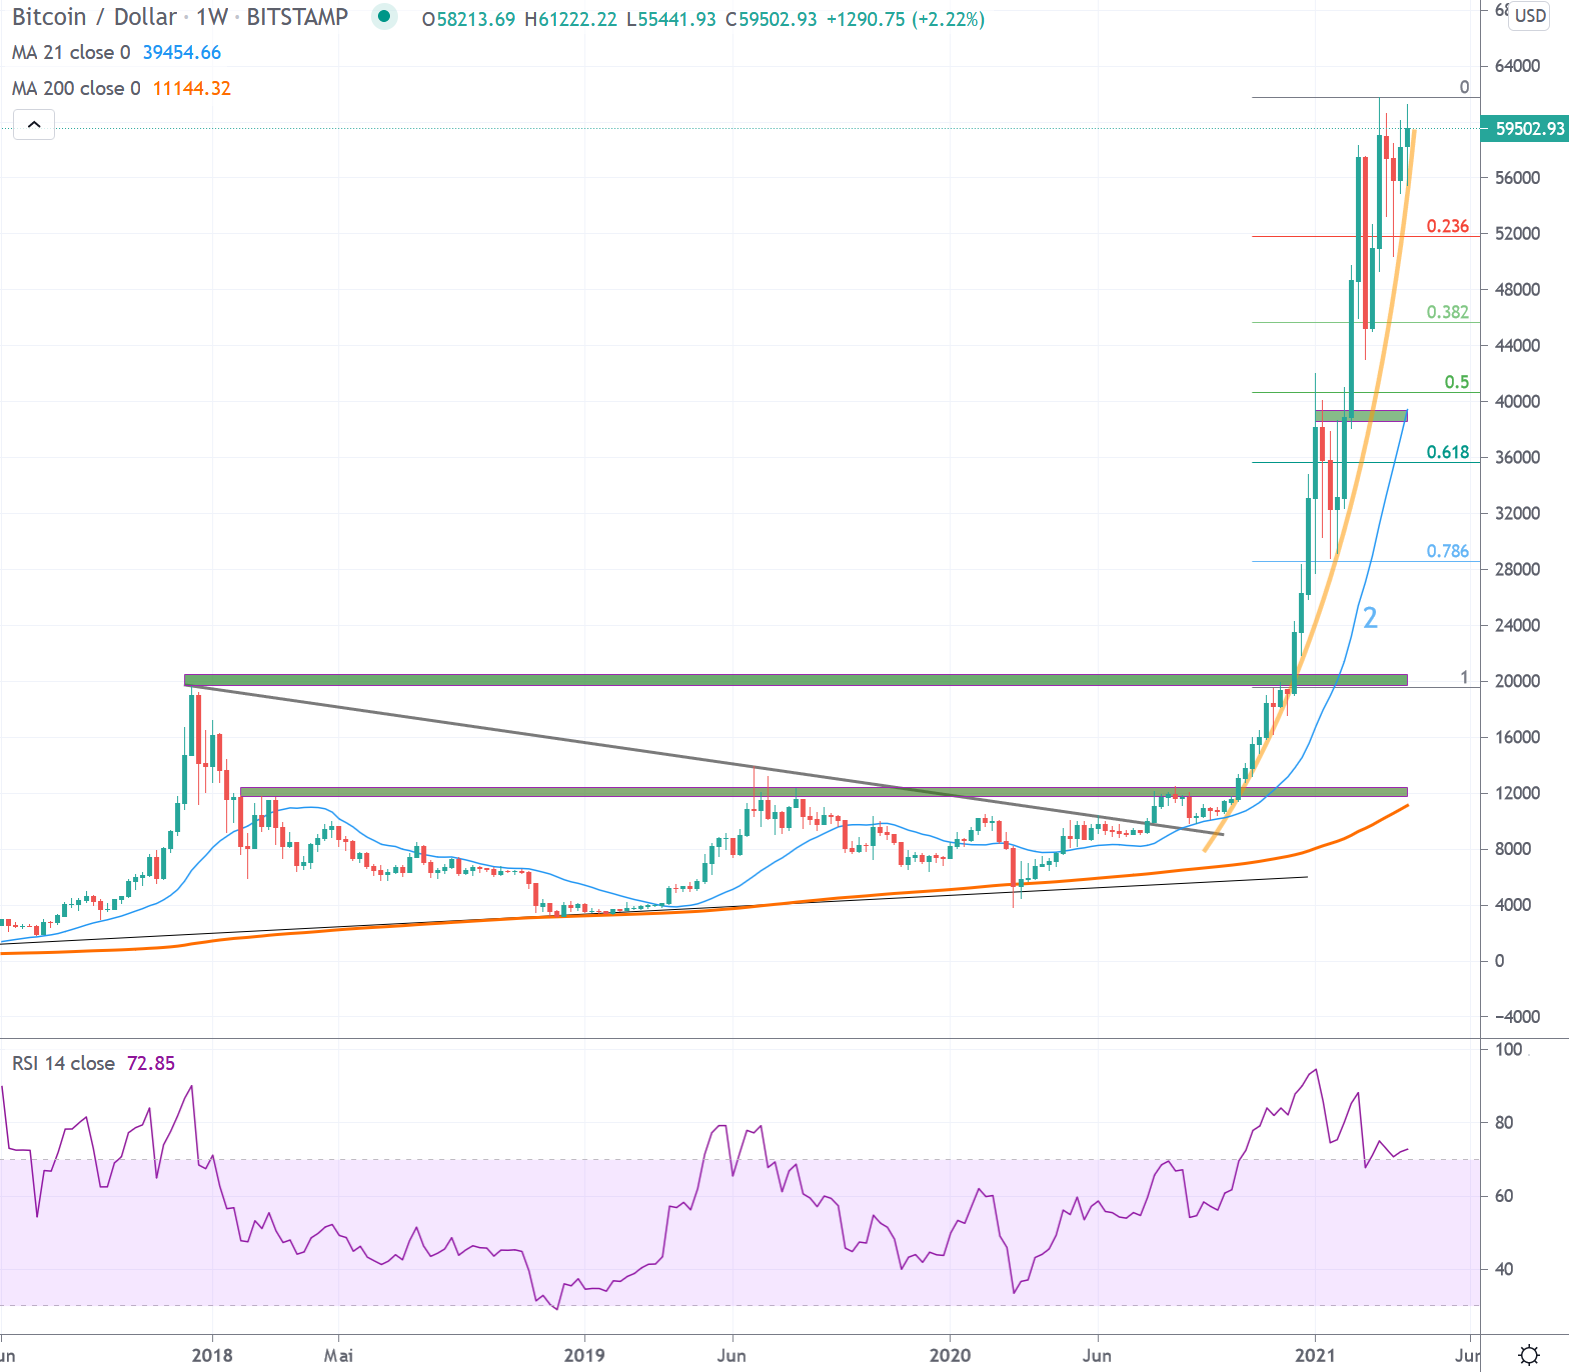
Bitcoin was able to set a higher all-time high above 10’000 USD for the first time in the weekly interval in 2020, which broke the prevailing bearish trend since December 2017. This broke the series of lower highs that lasted for 135 weeks (1).
Since the break of the bearish trend, signs of a valid trend reversal have been building up. With the push through important resistance zones and a continuous development above the 21-week average (2), the probabilities for a renewed reaching of the all-time high created in 2017/18 increased. This was accomplished in mid-December 2020. Since then, a strongly accentuated price discovery above this mark has been taking place.
With the price movements in the past year, a good foundation was created to sustainably climb new spheres beyond the all-time highs reached in 2017. The break of the 20’000 USD mark impressively demonstrated the power of the upward movement that had been established since October. It led to a parabola (yellow), which is currently ongoing and reached its first high at just over 42’000 USD. After a one-month correction, this was continued and found its high above 58’000 USD. After a second correction phase, the price recently reached its preliminary all-time high below 62’000 USD in the ongoing price discovery phase. Apart from that, there are no resistances for the time being.
Bitcoin’s parabolic price discovery mode is still intact. For the time being, this speaks for good chances to continue creating new highs in short intervals. In case of an incipient correction, respecting the previously created supports (green) over the next weeks/months will be necessary to make the initiated phase of exploration in new price spheres sustainable. A departure from the parabola (yellow) would indicate a future slowdown of the upward movement and makes further and longer-lasting corrections more likely. Should these begin, the support zone at 39’000 USD, formed by the one-month march stop, remains to be observed first. In case of a continued correction, the 21-week average (2) becomes relevant, which so far could reliably indicate bull and bear phases. This is currently in the area 39’000 USD and rises accordingly fast. Further support zones in the weekly interval can be found in the area of 20’000 USD.
*Originally posted at CVJ.CH
Disclaimer
All information in this publication is provided for general information purposes only. The information provided in this publication does not constitute investment advice and is not intended as such. This publication does not constitute and is not intended as an offer, recommendation or solicitation to invest in any financial instrument, including cryptocurrencies and the like. The contents contained in the publication represent the personal opinions of the respective authors and are not suitable or intended as a basis for decision-making.
Risk notice
Investing in cryptocurrencies, is fundamentally associated with risk. The total loss of the invested capital cannot be excluded. Cryptocurrencies are very volatile and can therefore be exposed to extreme price fluctuations in a short period of time.
