
As 2020 draws to a close, here’s a roundup of the year’s best charts and analysis. Data is central to understanding cryptocurrency markets so this report is designed to cover all the crucial market events of 2020 – a compilation of 50+ data-driven analyses and in-depth reports.
While this past week was hands down one the most eventful of the year (Bitcoin broke $27k, XRP tanked following SEC lawsuit) we are closing our final market review of 2020 with a slightly different format, showcasing the charts that best encapsulate this turbulent year.
1. March: The “Black Thursday” Market Crash
The market crash of March 12th and 13th, since dubbed “Black Thursday”, will go down in history as one of the steepest and most rapid sell-offs to ever sweep cryptocurrency (and traditional) markets. The crash spared no asset and led to a liquidity crisis which perpetuated the free fall in prices.
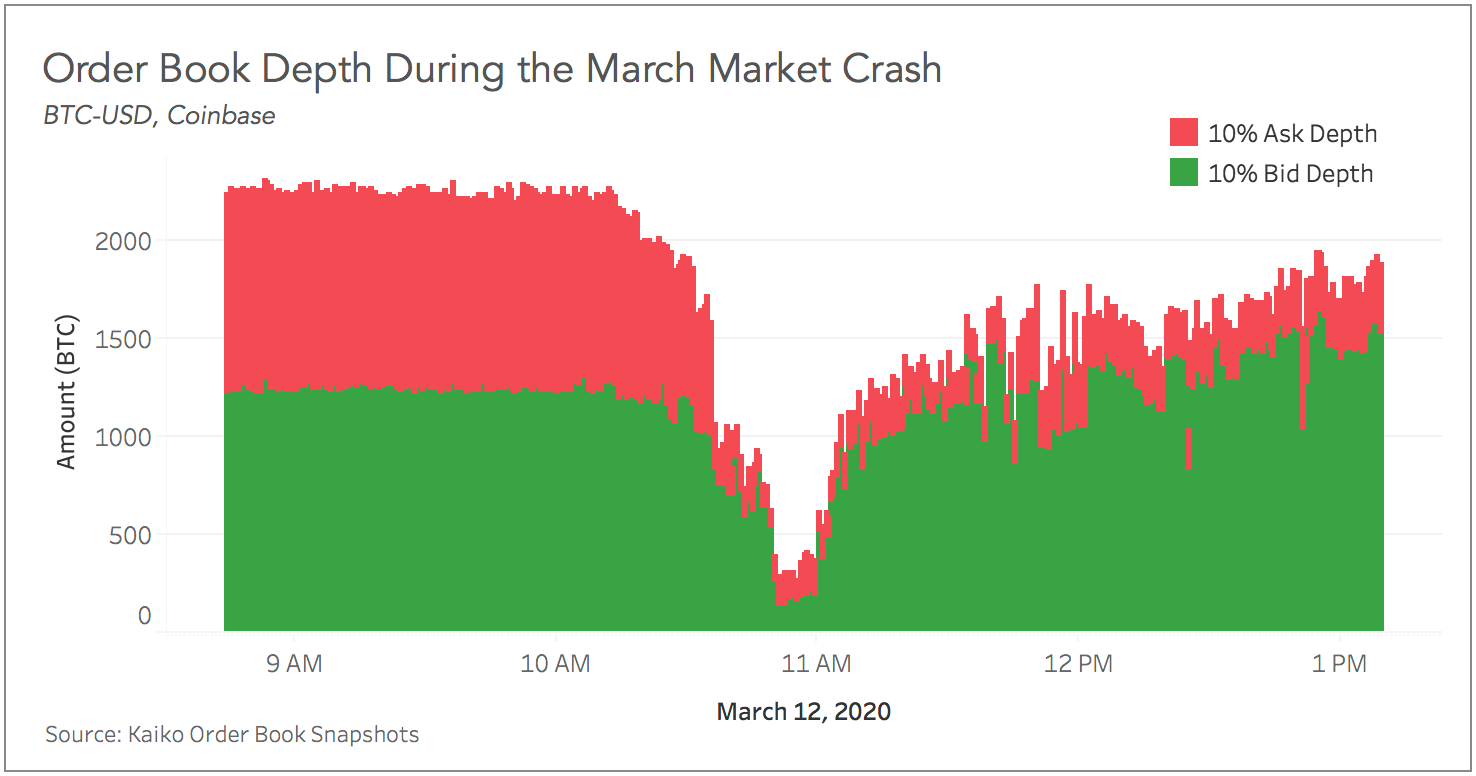
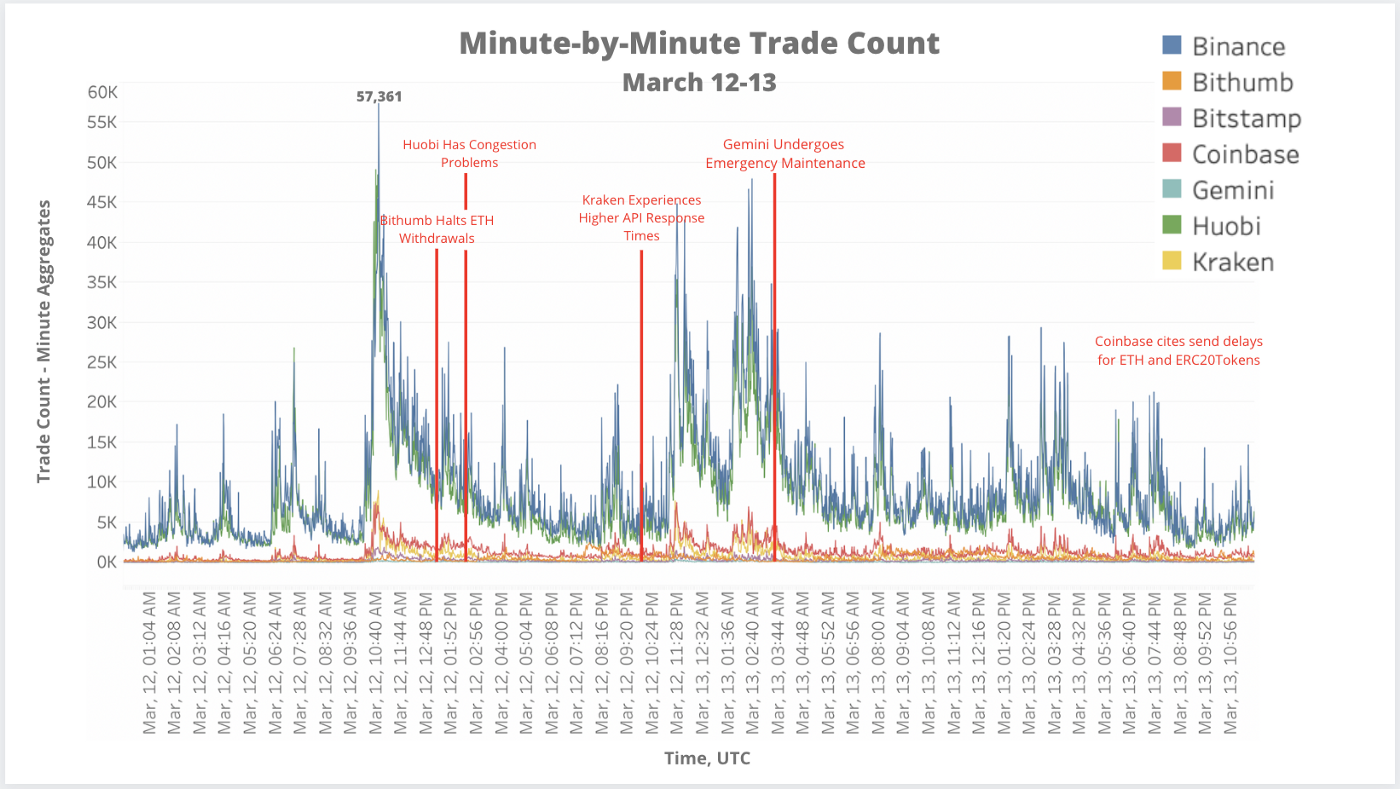
Using Coinbase‘s BTC/USD order book, we can observe the rapid deterioration of the bids and asks immediately surrounding the midprice. As the first price crash began, the bid side of the order book got completely decimated as a result of extreme selling pressure, with virtually no bid orders remaining. This liquidity crisis triggered a feedback loop which saw prices tumble as market sell orders were filled at increasingly less favorable price levels. As the price crash unfolded, numerous exchanges suffered outages as record numbers of trades were made in a matter of minutes.
1. April: Digital Dollars Dominate
Stablecoins were one of the most prominent trends of 2020 as private tech companies, large banks, and public central banks took their stablecoin experiments public. In the cryptocurrency industry, Tether’s continued growth was on everyone’s mind. Throughout the year, its monthly volume traded against Bitcoin, compared to the Dollar, took on new magnitudes, a trend that first emerged in 2018.
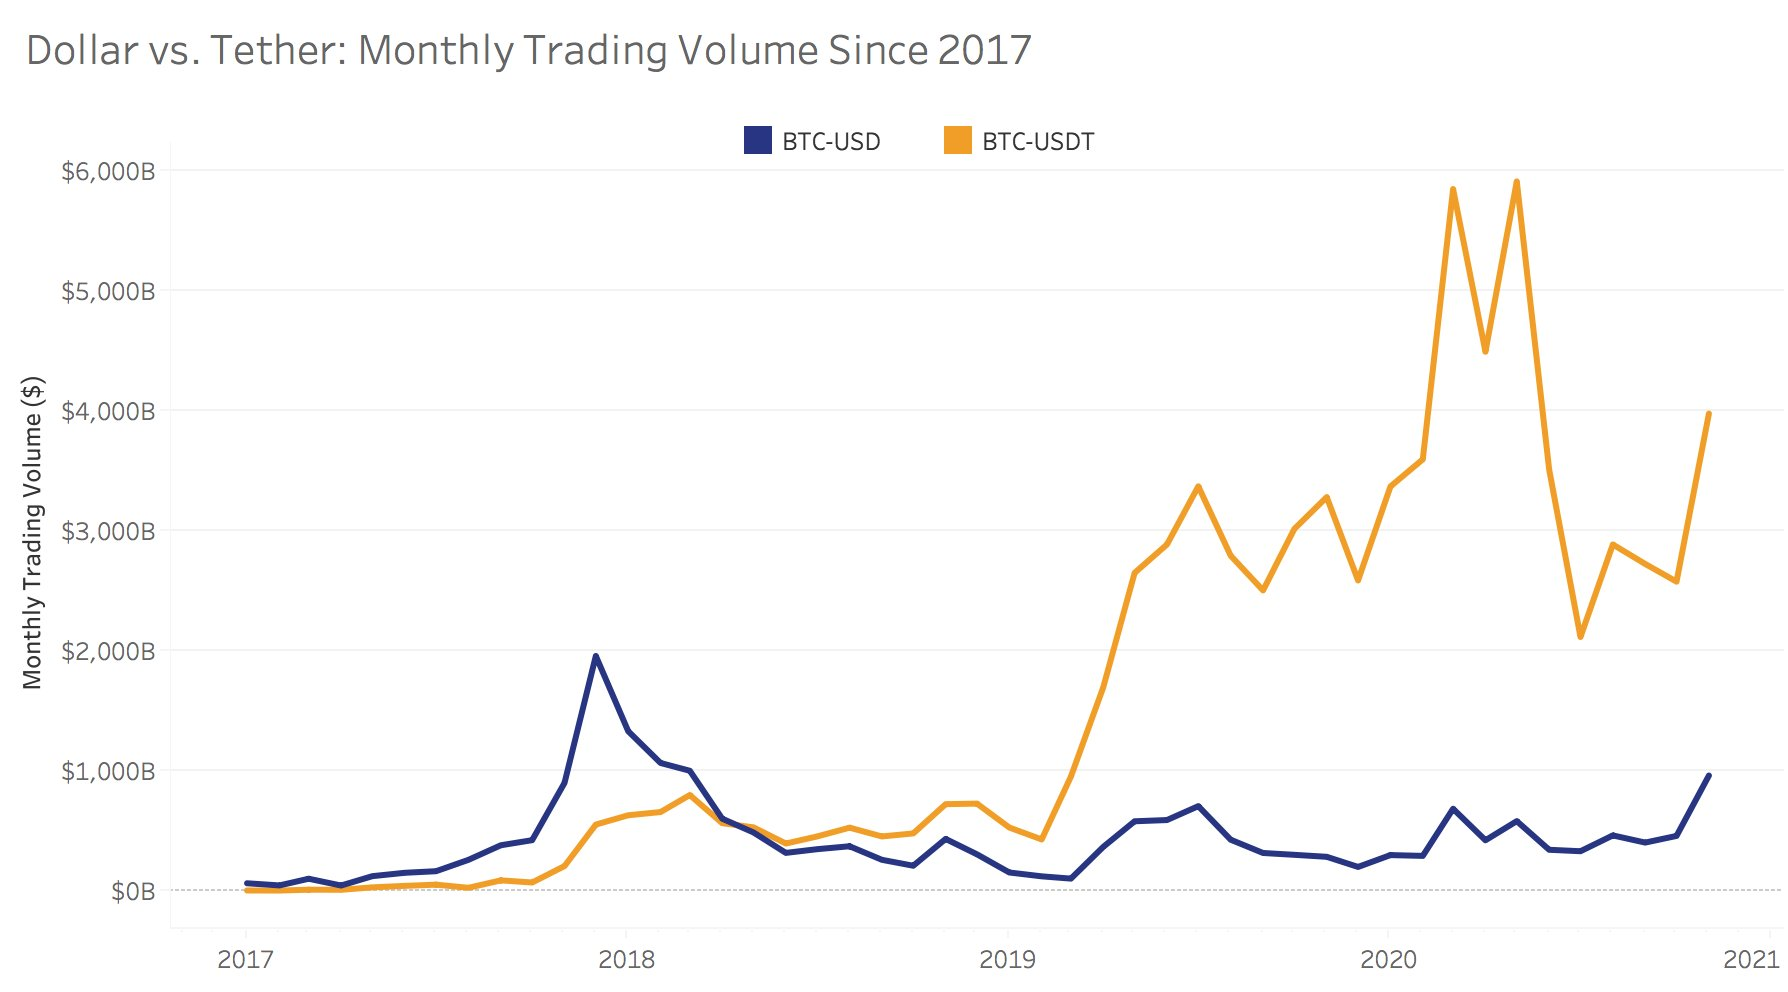
- Trading volume is much higher for Tether markets compared with USD markets, and this holds true over time.
- BTC/USDT markets are far less concentrated than BTC/USD markets.
- BTC-USDT and BTC-USD closing prices (across exchanges) closely mirror each other with very small tracking errors.
- BTC-USDT and BTC-USD daily returns display different volatility regimes over time.
1. May: An Analysis of Bitcoin Historical Volatility
Bitcoin’s volatility is one of its best known (albeit, most controversial) qualities. Historical volatility is a backward-looking measure on which relatively old events can have large effects. Therefore, it is important to carefully understand the calculation methodology to make informed decisions.
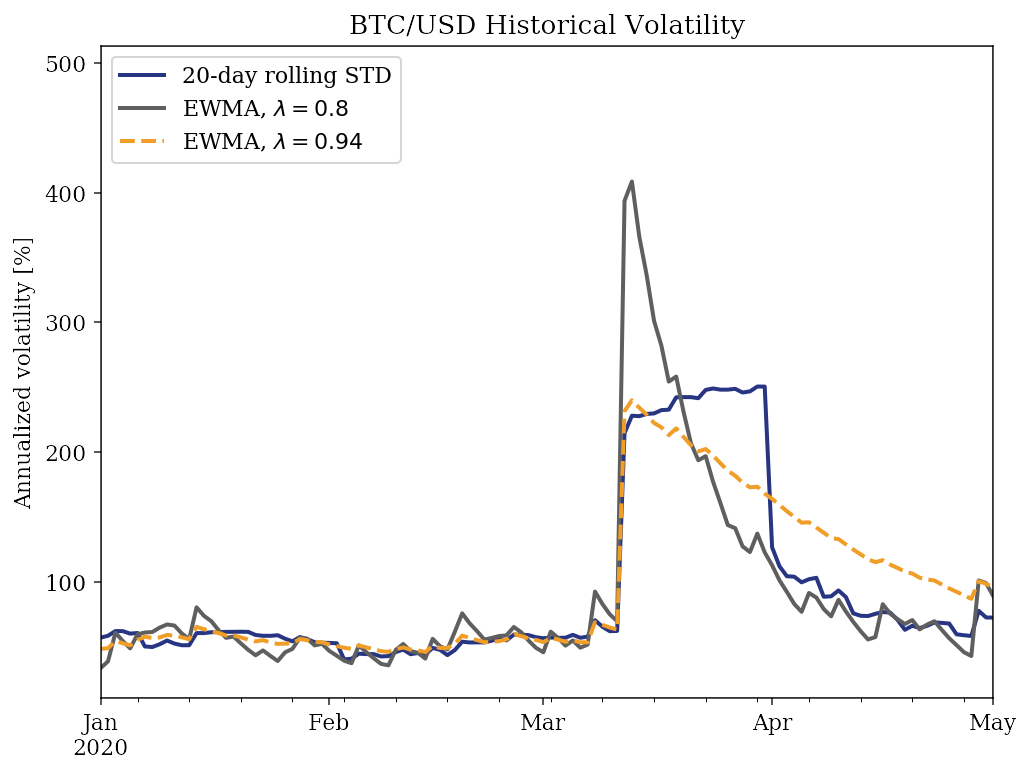
The figure above shows a comparison of the regular 20-day moving average (MA), an exponentially weighted moving average (EWMA) using the RiskMetrics decay factor, and finally an EWMA with a decay factor of 0.8 in order to increase the emphasis on recent events. We can observe that an exponential moving average with a decay factor of 0.8 was shown to be reactive to the recent rapid market activity whilst retaining relatively low noise.
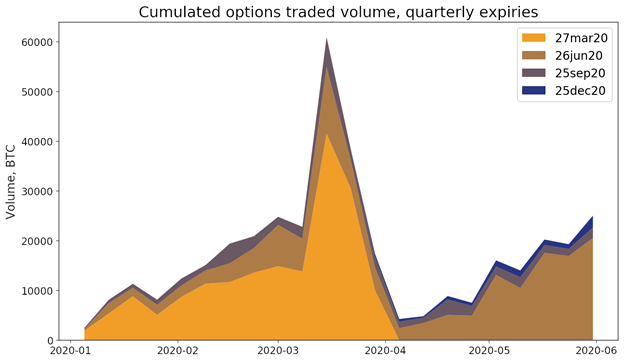
1. June: Options Markets Take Off
On January 13th 2020, the CME Group launched Bitcoin options, joining the growing number of firms offering this type of derivatives contract. The recent development of a liquid futures market (both perpetual futures and futures with fixed rolling maturities) made it easier over the past year to build more complex derivatives, making options trading possible at a larger scale. Options contracts are beneficial for cryptocurrency markets because they offer traders the ability to hedge against the risk of sudden price changes.
1. July: Whales are Coming
As more institutions enter cryptocurrency markets, we can search for their presence on cryptocurrency exchanges by analyzing “whale trades”.
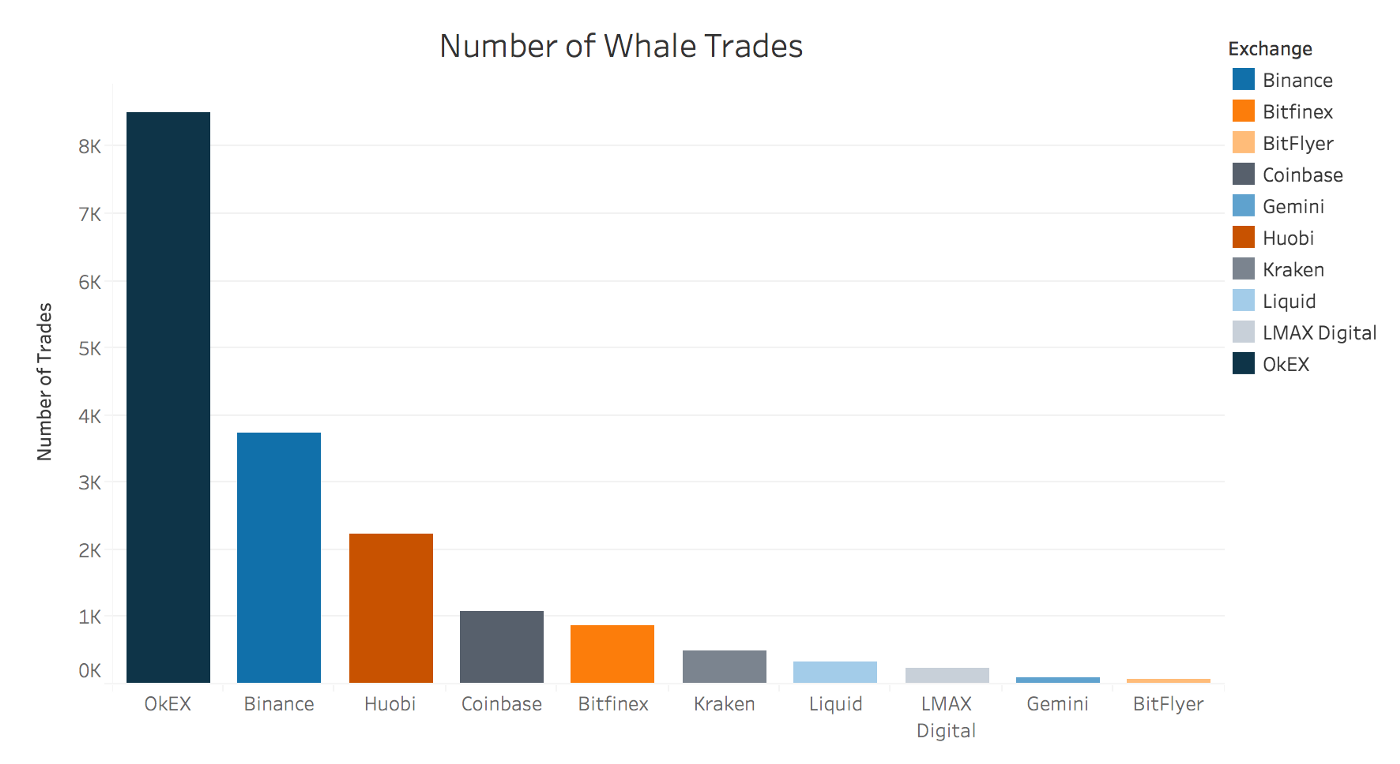
Each exchange has a unique composition of trades, at times unexpected. OKEx, by and large, had the most number of whale trades, the largest average whale trade size, and the largest daily trade every day for the month of June. Exchanges that had lower average trade sizes such as OKEx, Binance and Huobi, had higher average whale trade sizes, indicating that high-volume, more “retail-oriented” exchanges also have a significant user base of high-volume traders.
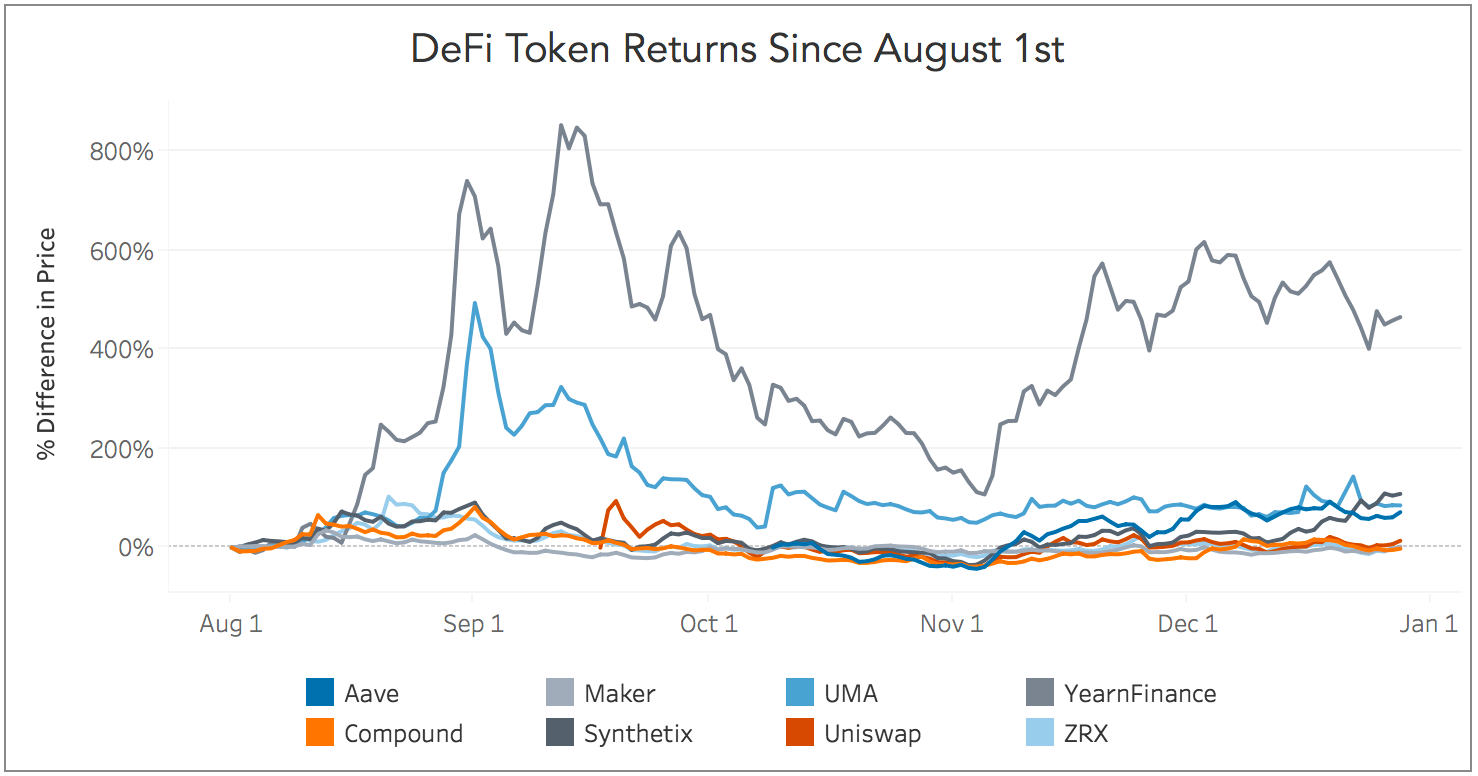
1. August: The Summer of DeFi
Summer 2020 was characterized by the viral growth of decentralized finance, which saw “DeFi” tokens experience massive returns as traders took up liquidity mining (YearnFinance gained +800% at its peak). The fun didn’t last into the fall, which saw the DeFi bubble burst dramatically. Although decentralized exchange volumes and DeFi token prices have since declined, the sub-sector is still growing and maturing. Below, we charted DeFi token returns since August 1st to show the monumental growth, crash, and rebound over the past month of the sector.
1. September: Exchanges Invest in Infrastructure
Exchange competition is heating up and many exchanges are investing in their infrastructure to win over more sophisticated traders.
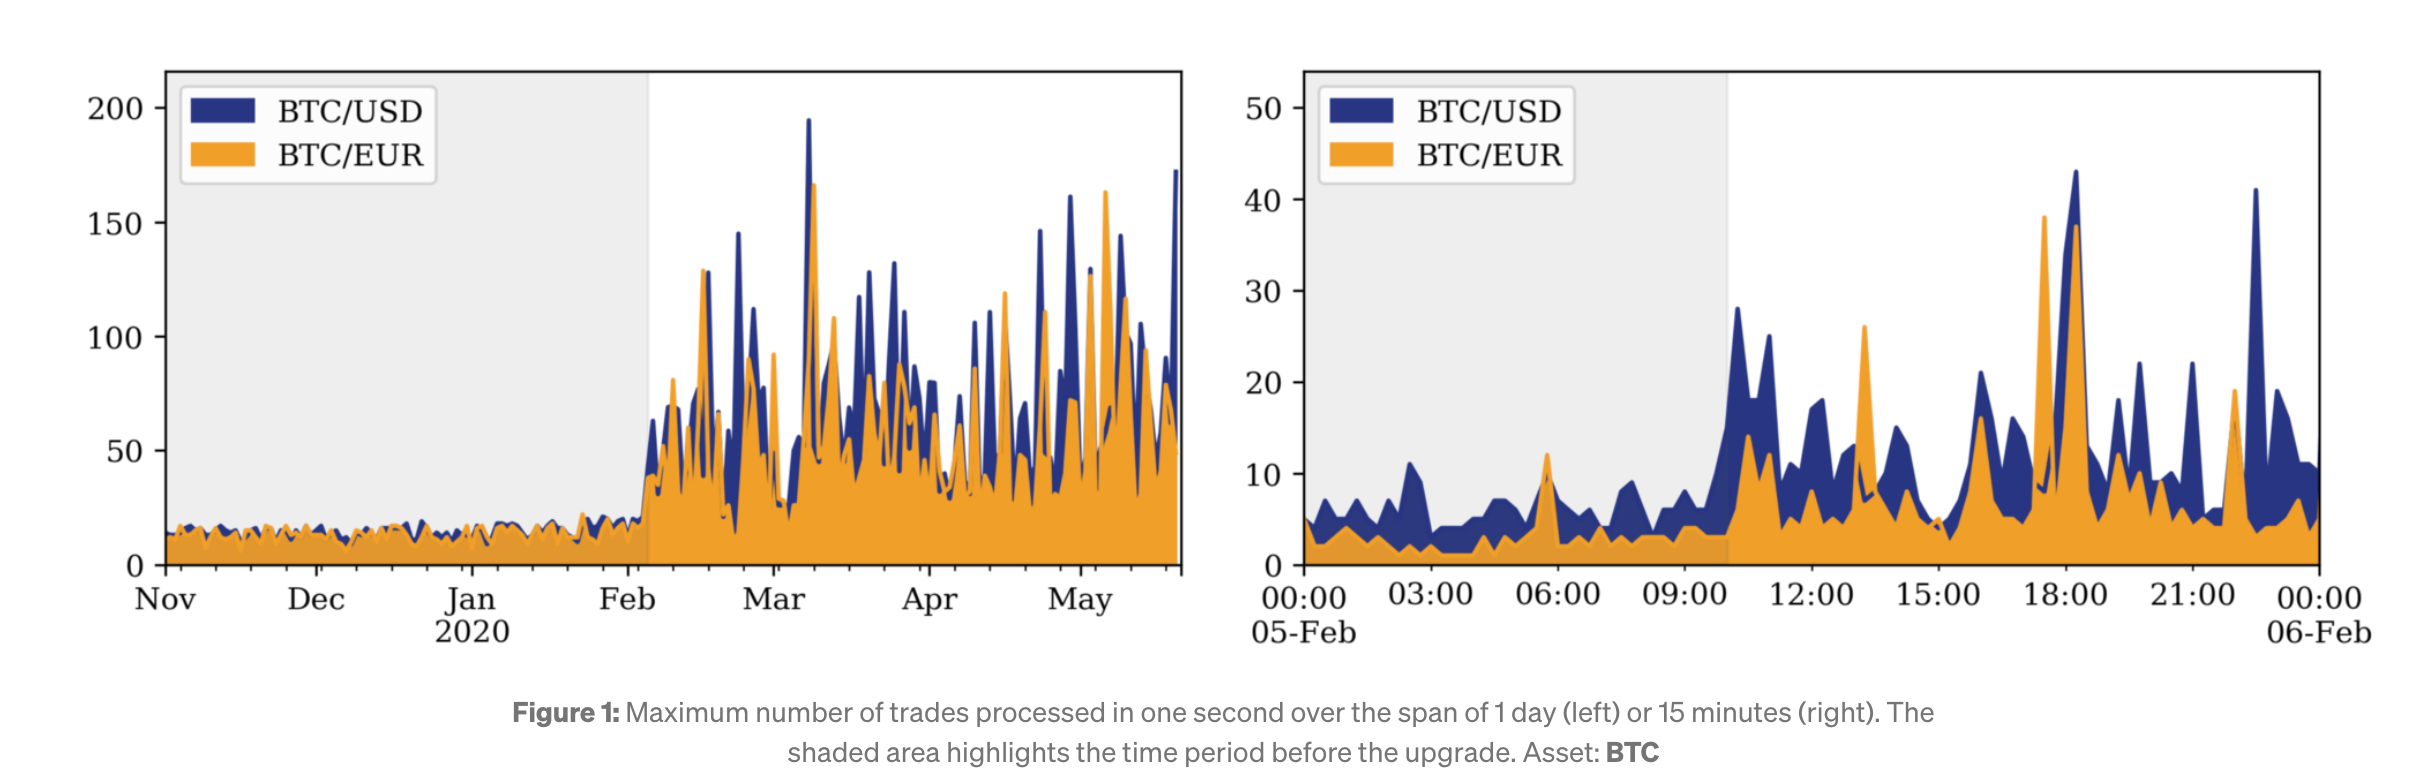
The figures show the evolution in the maximum number of trades Bitstamp processed over the course of one second (left chart) and 15 minutes (right chart). The introduction of the new matching engine is evident, with more than a ten-fold increase from approximately 15 trades/s before the upgrade up to about 200 trades/s after the upgrade.
1. December: All Time Highs for Bitcoin!
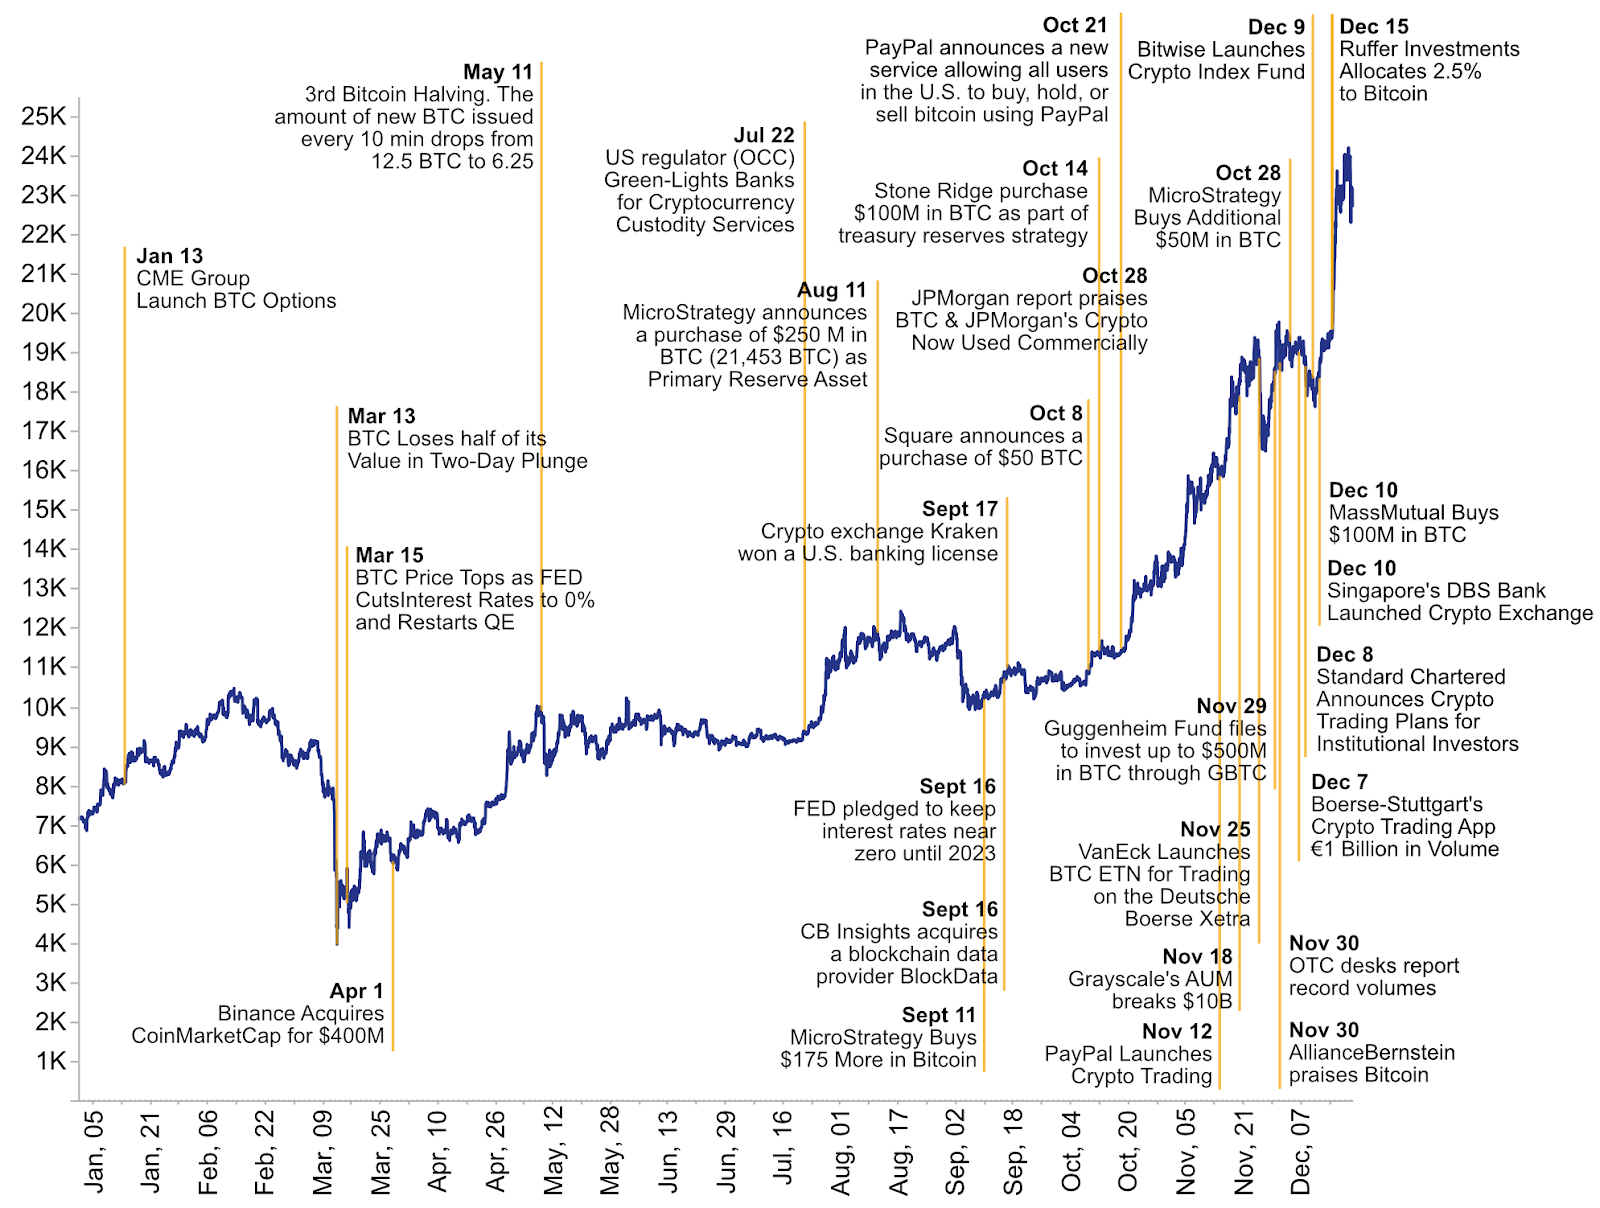
If 2020 will be remembered for anything beyond Covid-19, it’s that this was the year that institutions came en masse for Bitcoin. The pandemic generated the perfect market conditions for this monumental shift in sentiment to occur, from aggressive fiscal stimulus in the U.S. to a falling dollar to fears of inflation to irrational equities markets. Ultimately, economic uncertainty created a ripe environment for institutions to take a closer look at Bitcoin and recognize its value as a hedge against anything and everything that could go wrong in traditional financial markets.
Bitcoin’s adoption by institutions, which picked up around October, is largely credited with initiating this current bull run. The flow of institutional news is becoming more steady, and December brought a whole new wave of interest, product plans, and investments by large traditional financial actors, summarized in the chart above.
*Originally posted at CVJ.CH
